Trends is a dynamic and interactive tool that lets you analyze and compare different Brands, Categories or keywords throughout a selected time frame to identify key trends in content.
Search
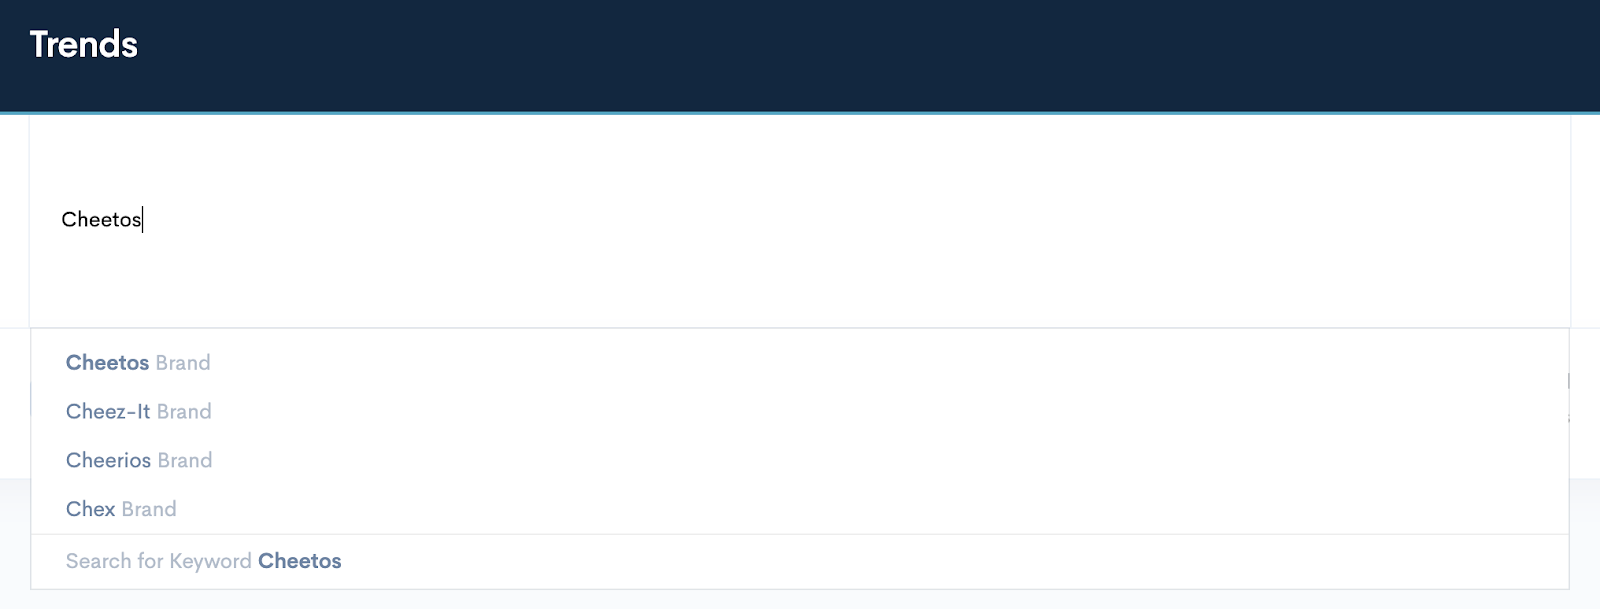
To begin a search, start typing in the Brand or keyword in the search bar. You will see a drop down menu appear for you to select the appropriate term.
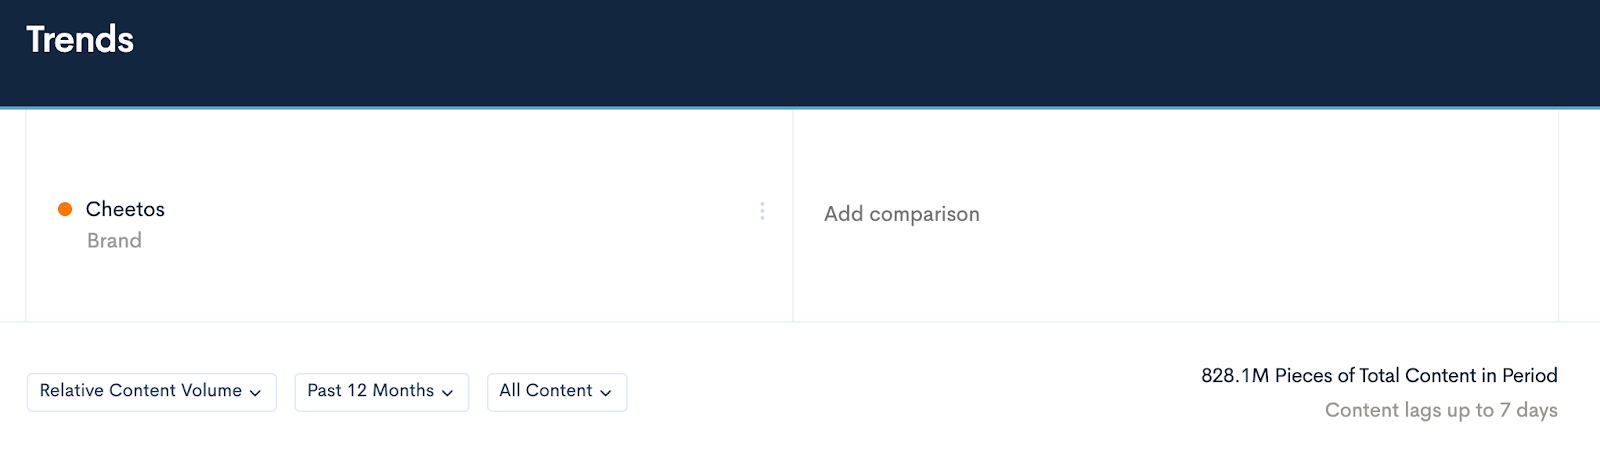
For comparison purposes, enter one or more additional search terms in the additional boxes to the right.
PLEASE NOTE: If a Brand does not appear in the drop down list, it may not yet be available in BrandGraph, but you can request it through the Suggestions tab.
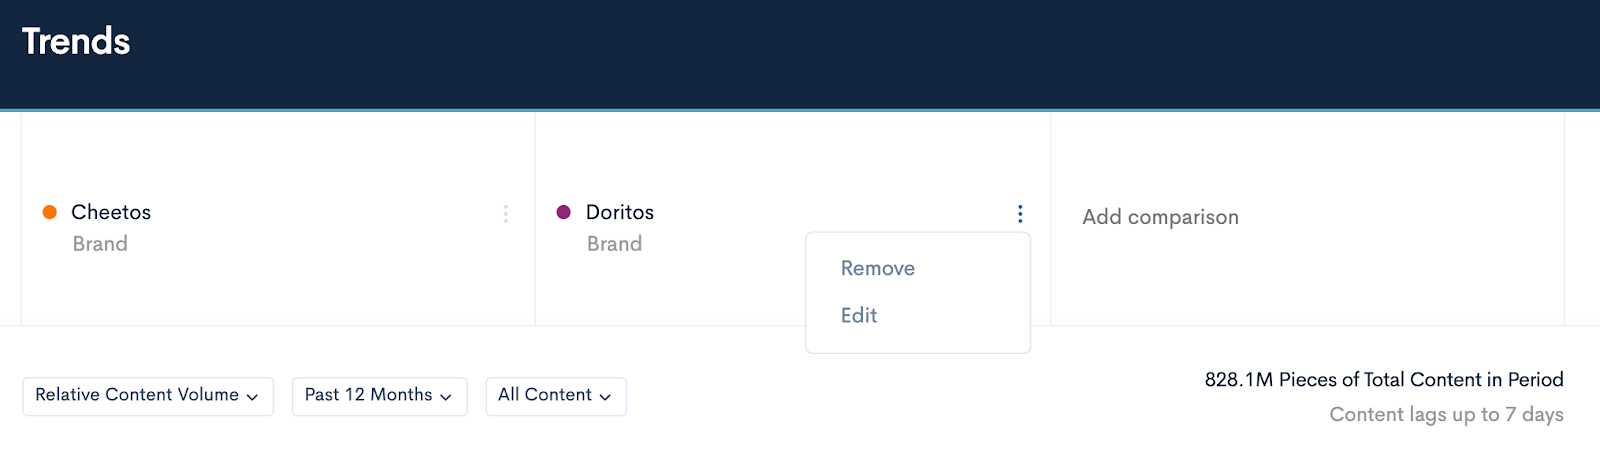
To remove or edit one of your search terms, click the snowman icon next to it and click on Remove or Edit.
Search Results
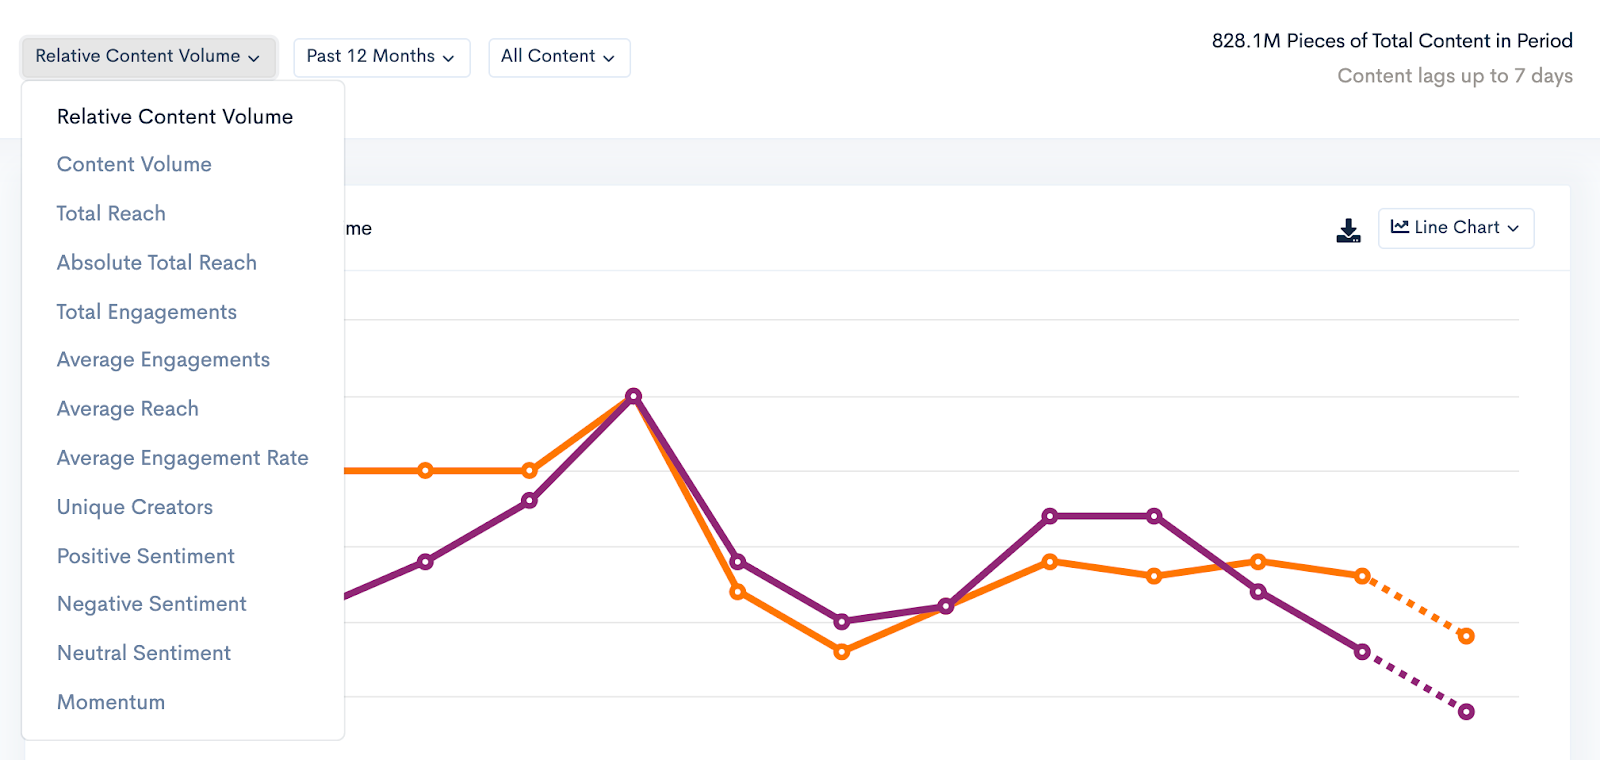
Once you have entered all of your search criteria, the results will populate below in a line graph, and can be filtered using the three boxes at the top. The total pieces of content being analyzed are provided at the top right of the chart. Please note that the 7 day lag time in content is represented by the dotted lines.
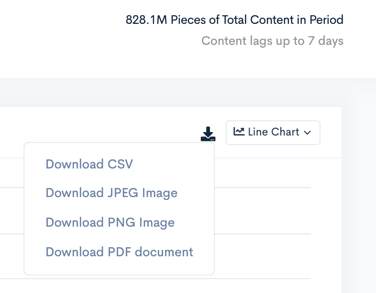
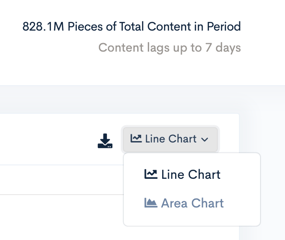
You can choose to download the chart by clicking the Download button, and switching between the Line and Area chart by using the drop down at the far right.
Filters
We have various filters to use in order to provide you with different types of analysis, all of which are explained in more detail in our help doc Filtering Trends. The default is set to Relative Content Volume, which provides you with a percentage of content volume as it relates to all content being analyzed in BrandGraph.
Time
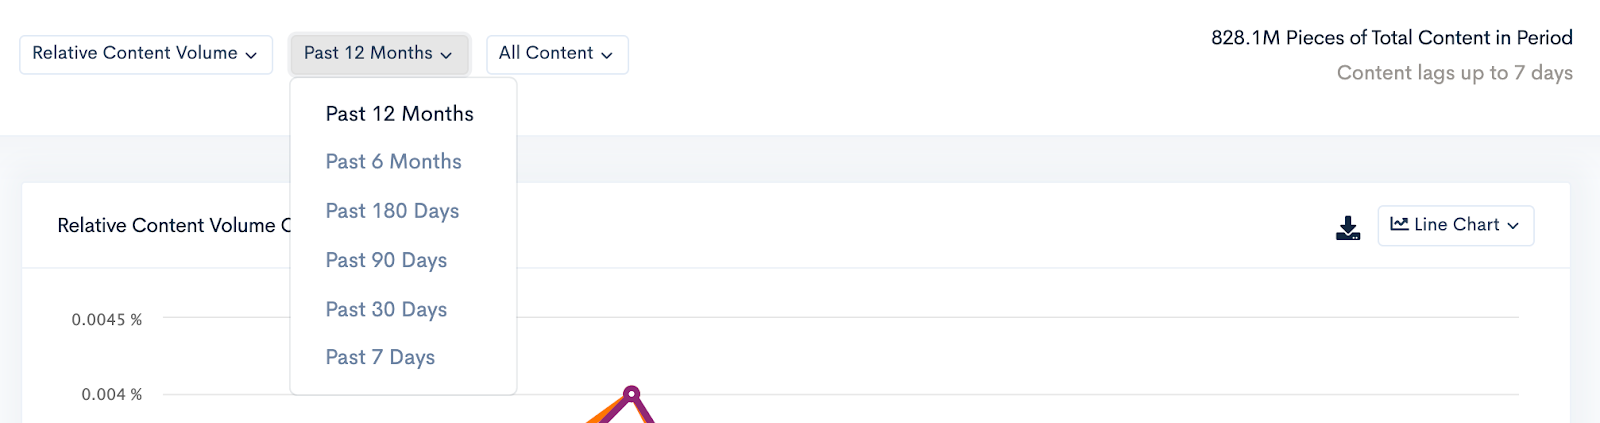
You can use this filter to narrow down your time frame for your search results. The default is set to the Past 12 Months, but you may see additional time frames by clicking on the drop down menu.
Content Type
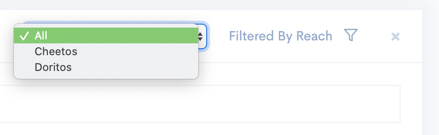
Within your search results, you choose to see All Content, or separate it by either Sponsored or Organic content by selecting on the third drop down menu.

Content Examples
The second section in Trends gives you examples of the pieces of content that match your search criteria for your selected date range. In this section you can click out to see the live post and use the Search function to narrow down your search results even further.
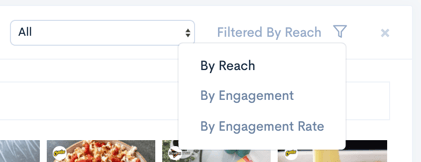
Using the actions buttons on the right hand side, you can choose to see all content or just one, and you can adjust the results filter by Reach, Engagements, or Engagement Rate.
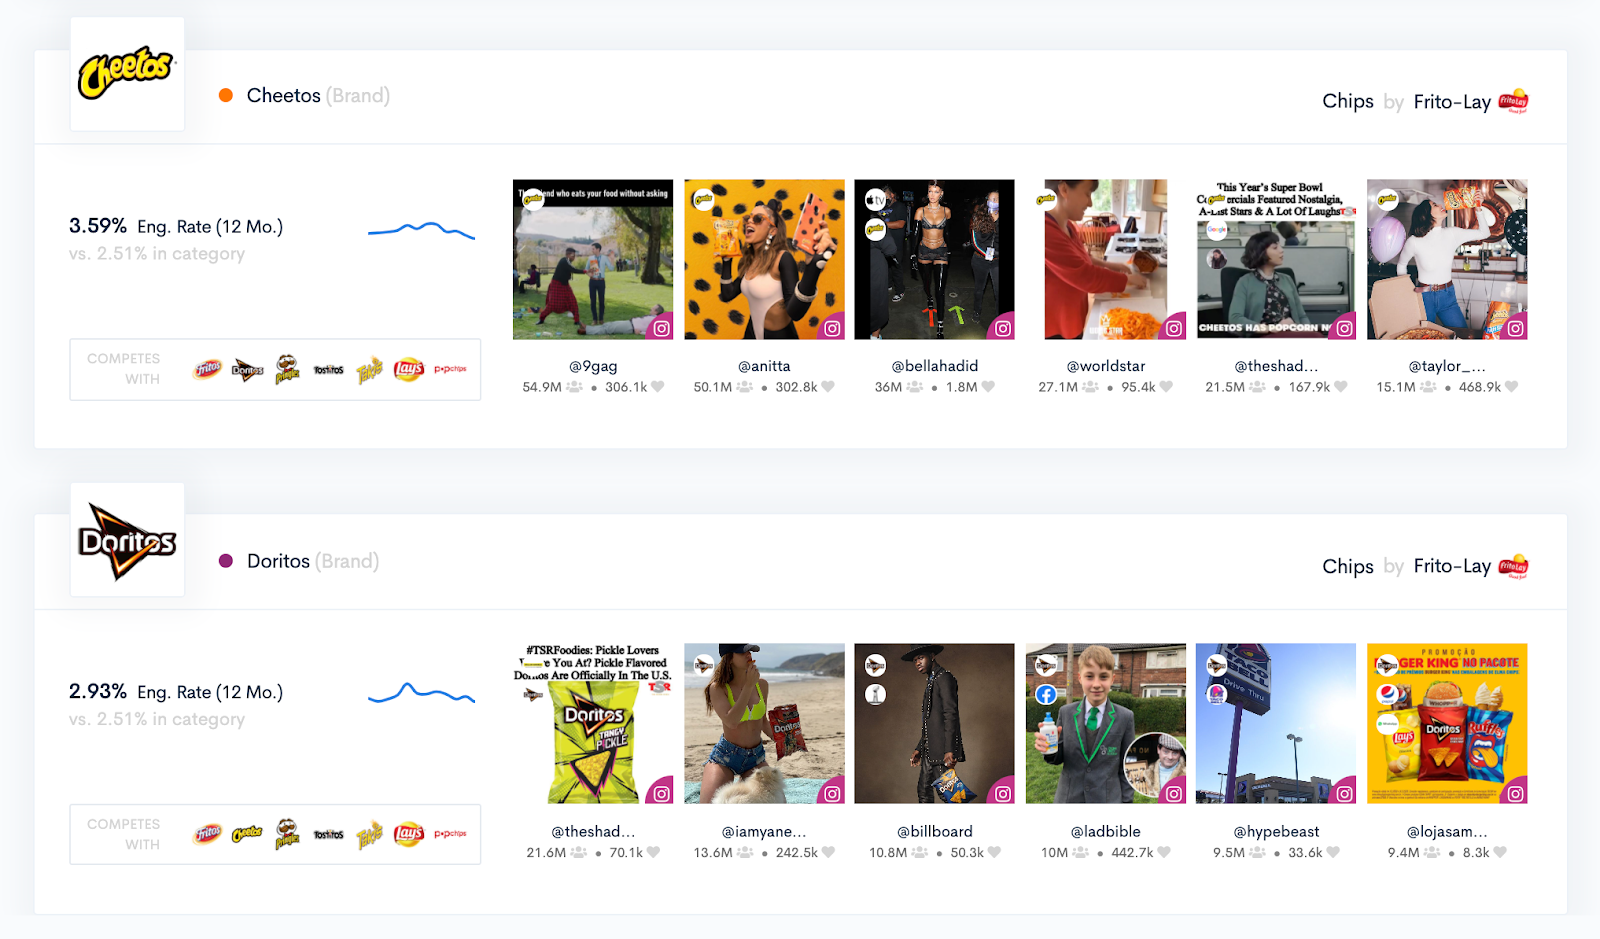
Brand Information
This last section in Trends provides individual information and pieces of content for the specific Brand(s) you searched, including:
-
Average Engagement Rate (over the last 12 months) for the Brand vs. the Category
-
Competitors of that Brand in their Category
-
Category and Owner of the Brand (top right)
-
Visit to the Brand page (by clicking on the logo)
-
Top posts by Reach for the Brand (clicking will bring you to the live post)