When using the Trends tool, there are numerous ways to filter your search results. This help doc will explain what the different filters mean, how those values are calculated and what the associate graph looks like.
For this example, we are using the brands Cheetos and Doritos for comparison.
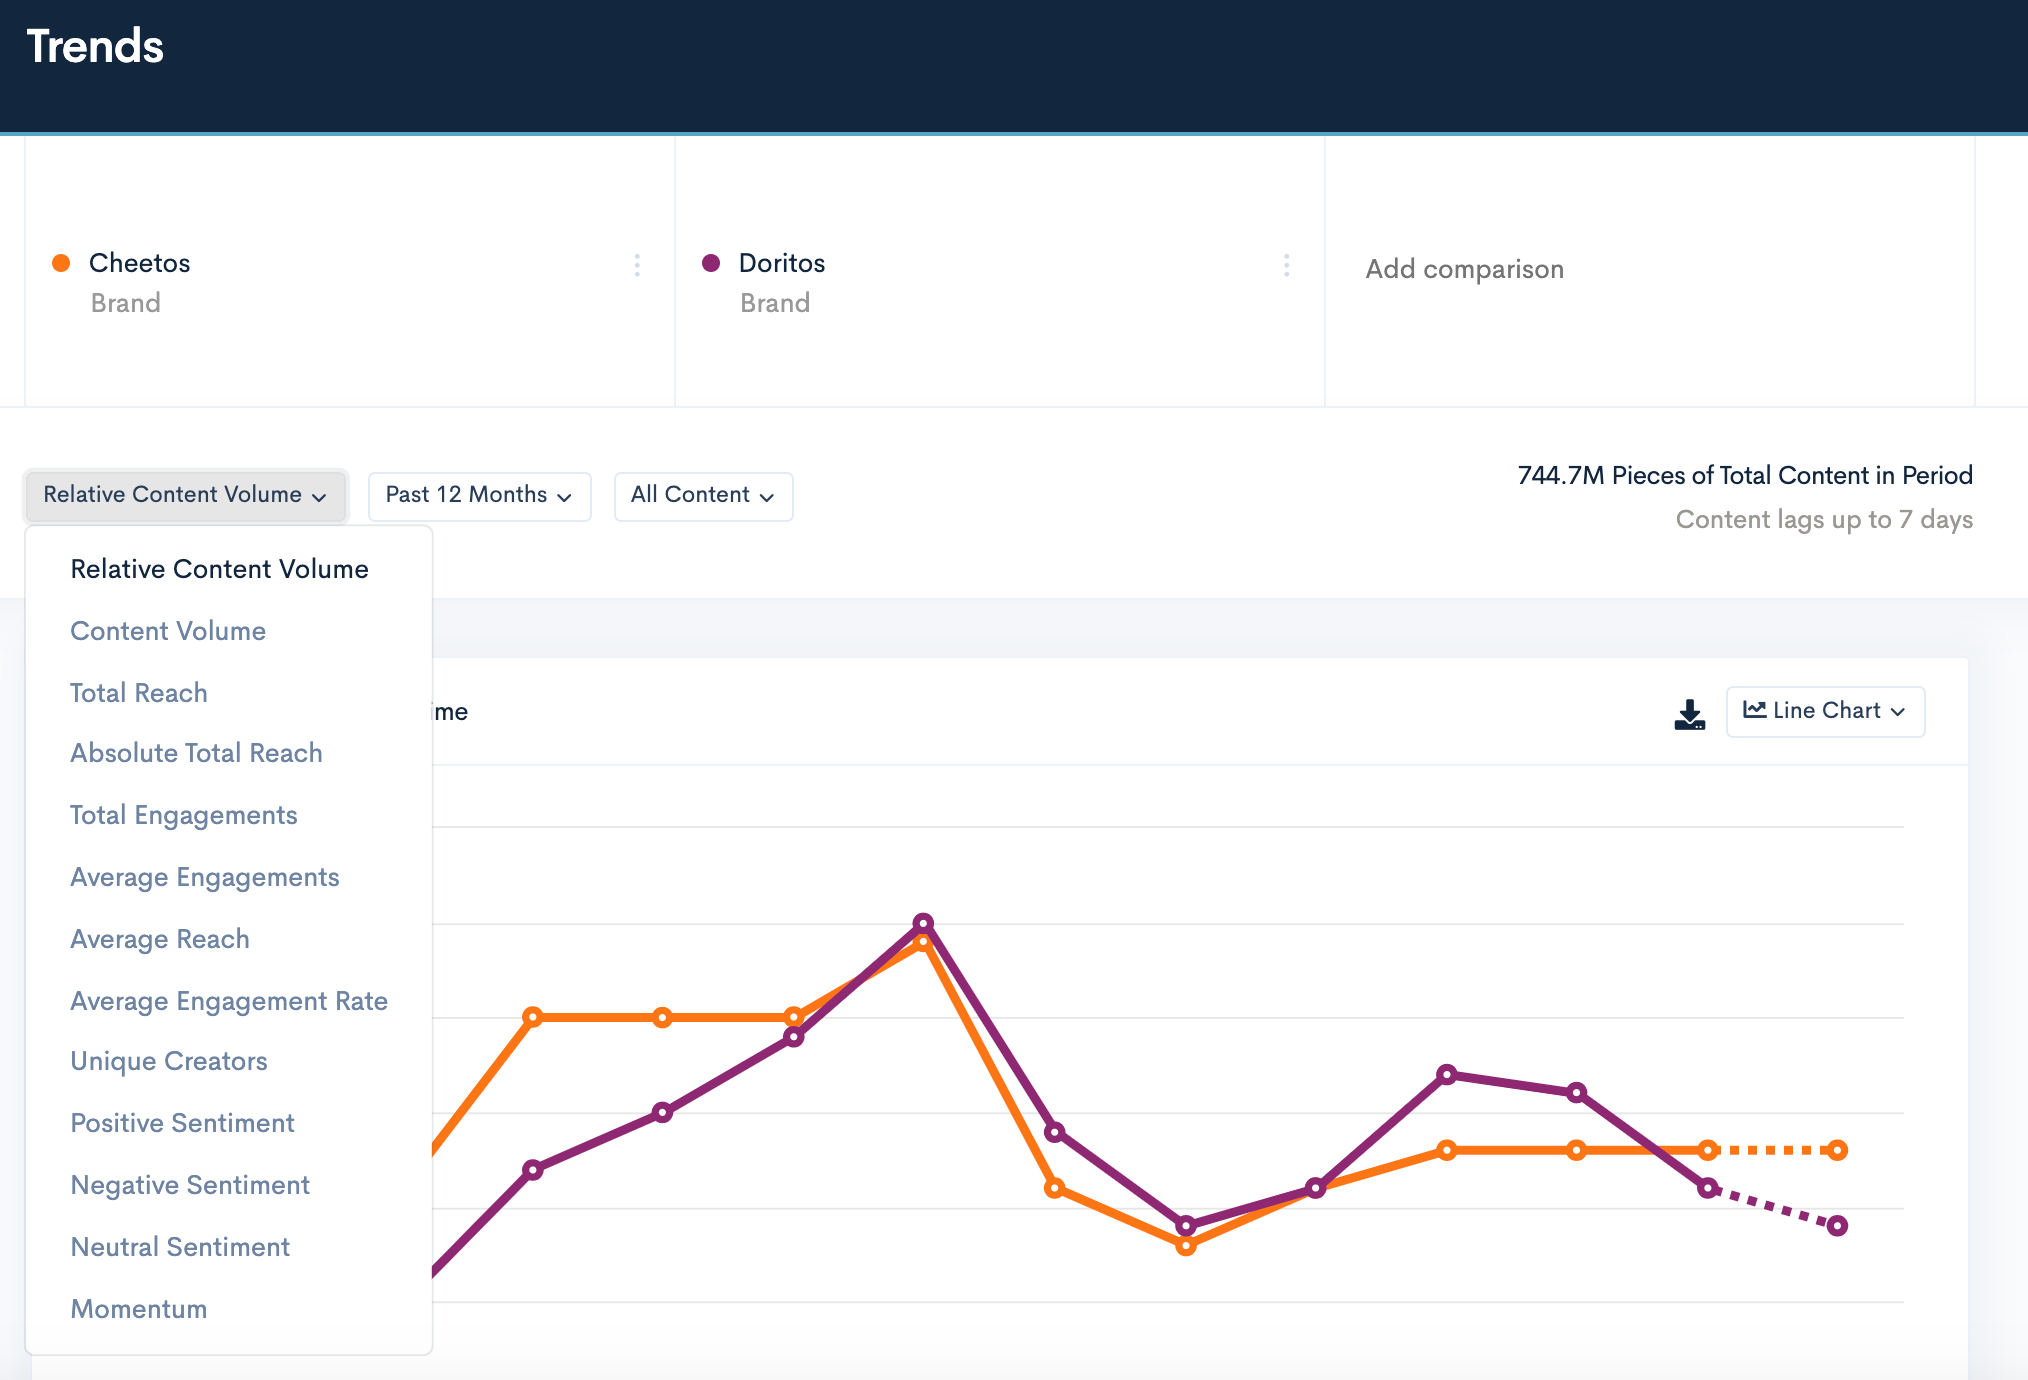
After entering at least two search terms, you can adjust the filters by selecting the first drop down menu to access the various metrics.
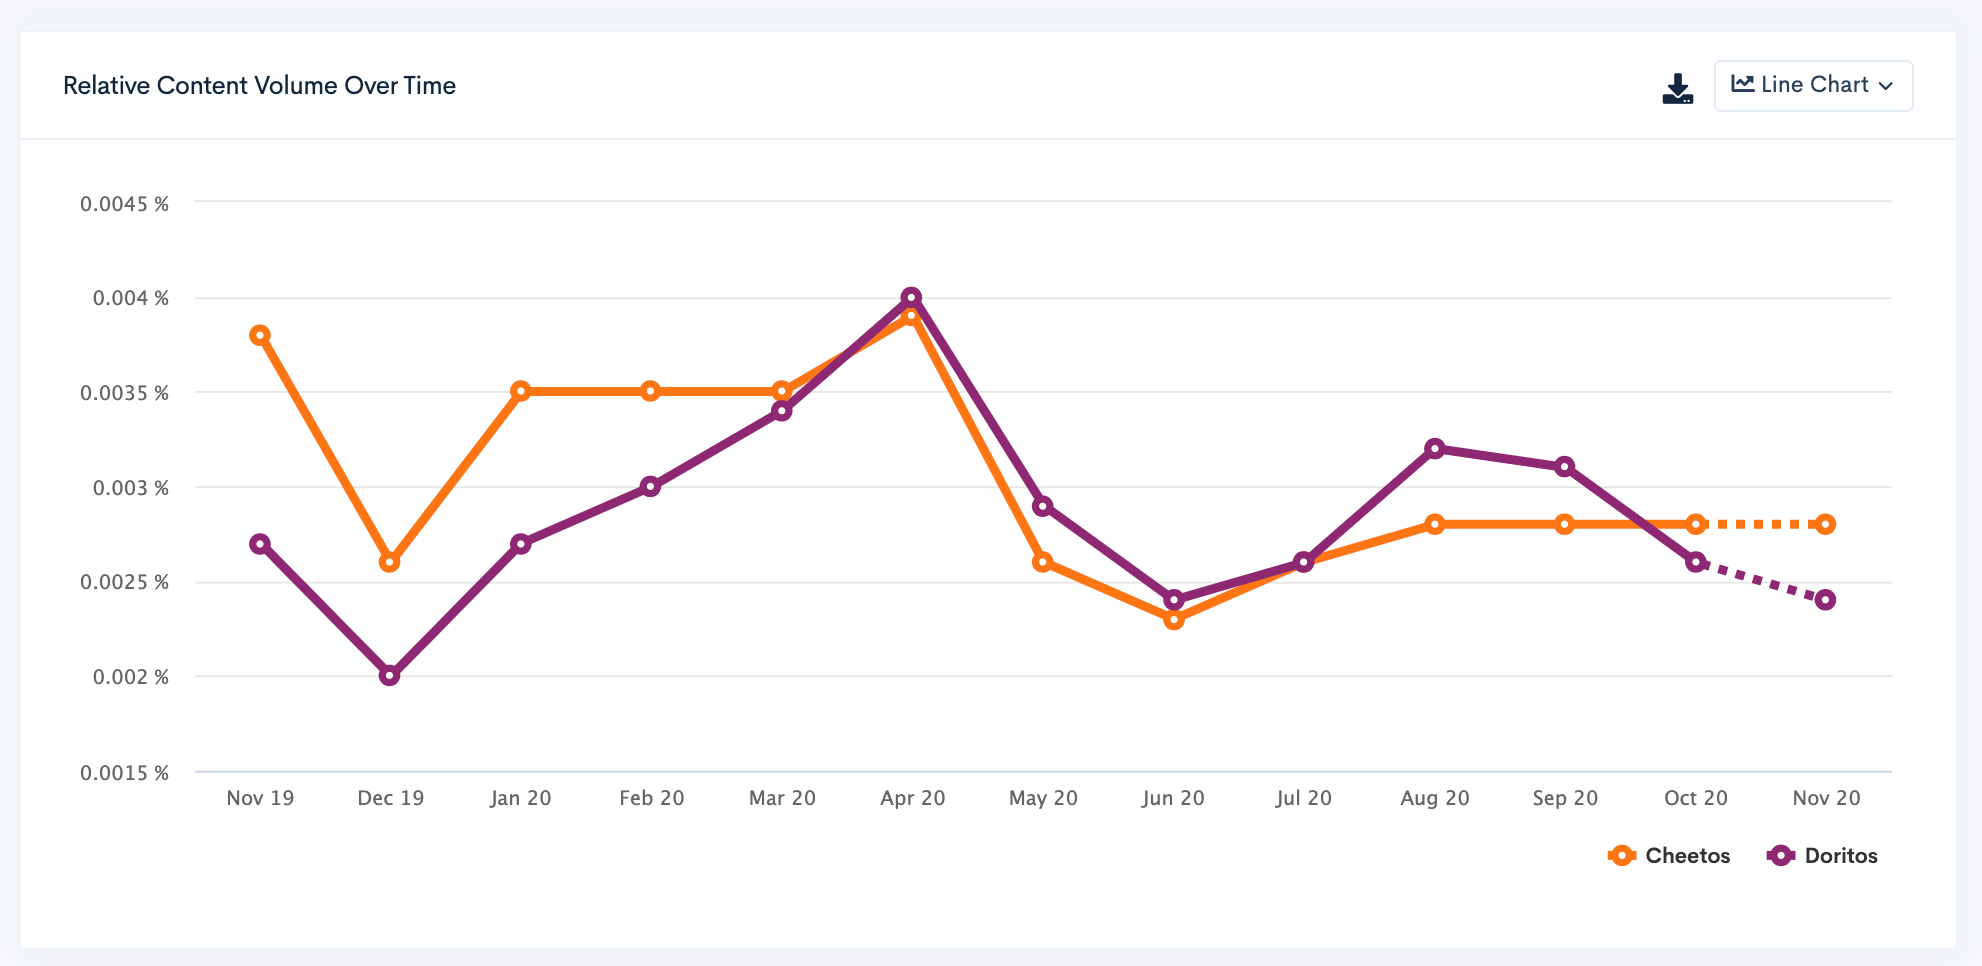
Relative Content Volume
This displays your search results as a percentage of content represented against all of the content currently in BrandGraph. As we have over 750MM+ pieces of content being analyzed in BrandGraph, and increasing daily, the percentage of your search may appear relatively low.
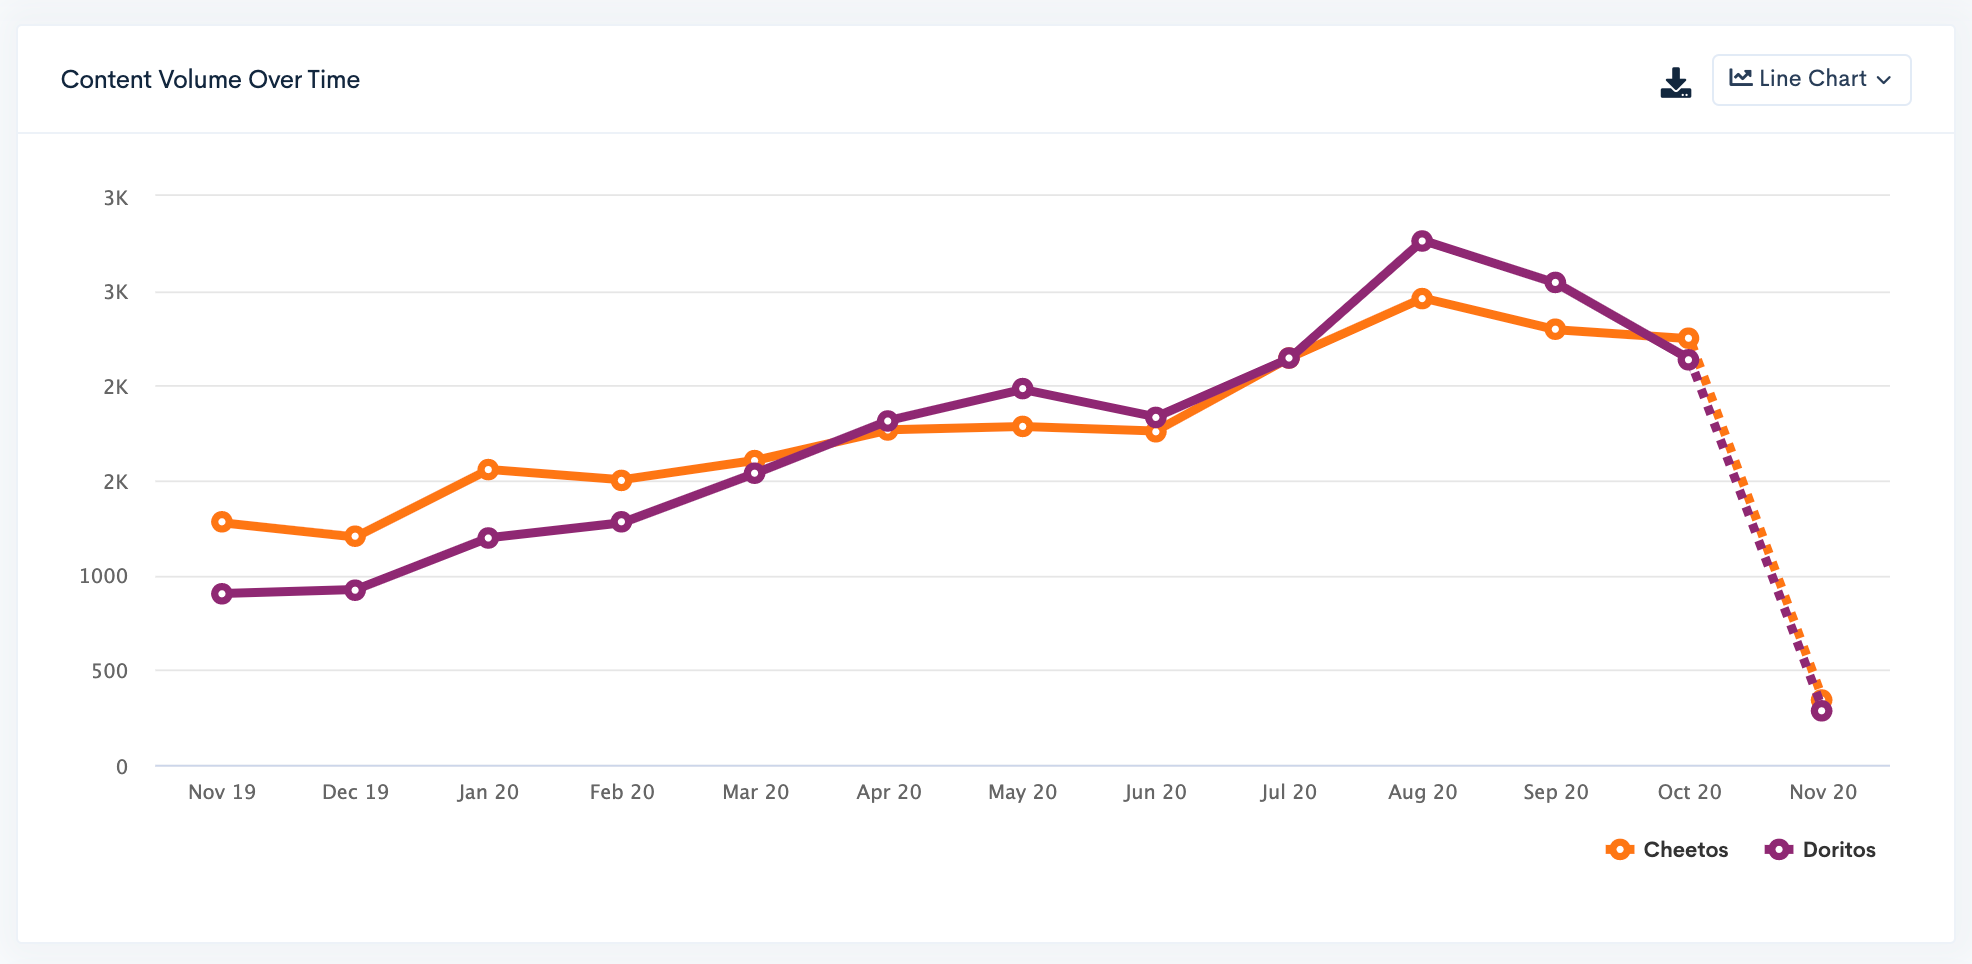
Content Volume
This number represents the total number of pieces of content that have been posted that references your search term(s). Using at least two search two terms will give you a comparison of Content Volume between them.
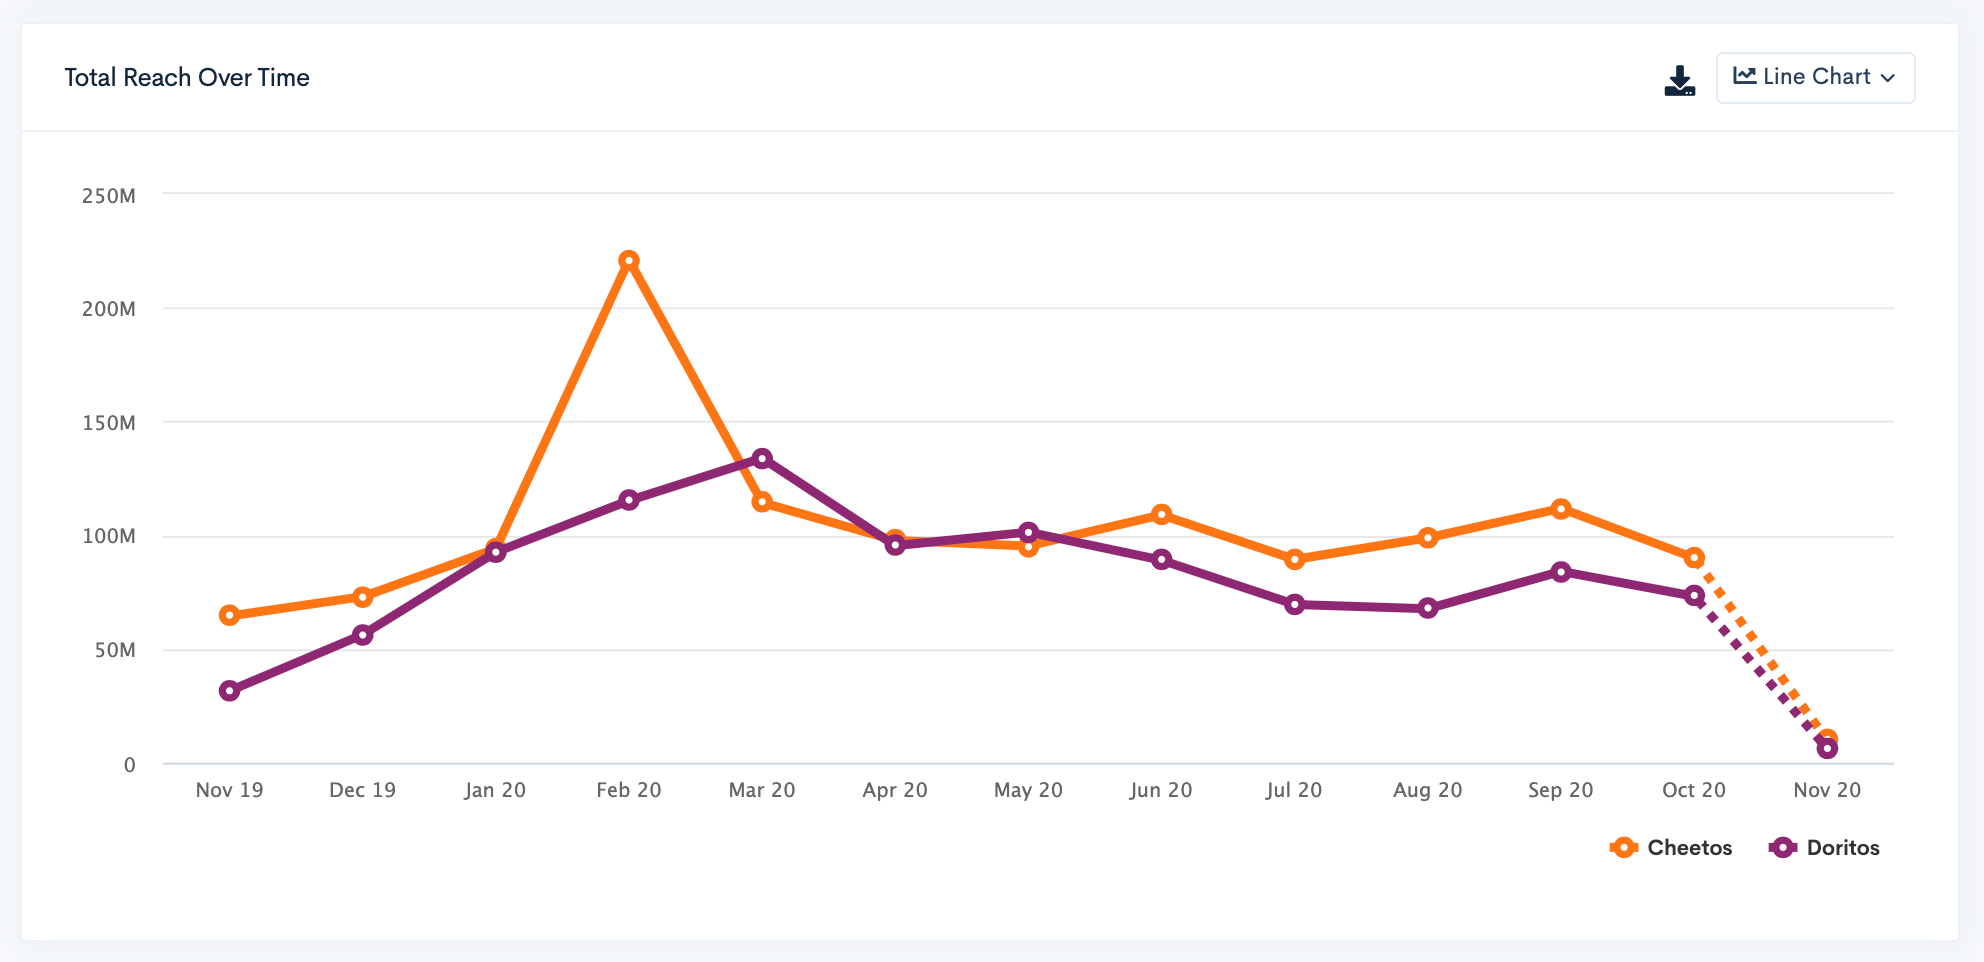
Total Reach
This is the aggregate reach (followers) of only the accounts posting about your search terms, but only counts their account once, even if they have posted multiple times. For example, if an account has 10,000 followers and posted 3 times using your search terms, their reach would be counted only once as 10,000 followers.
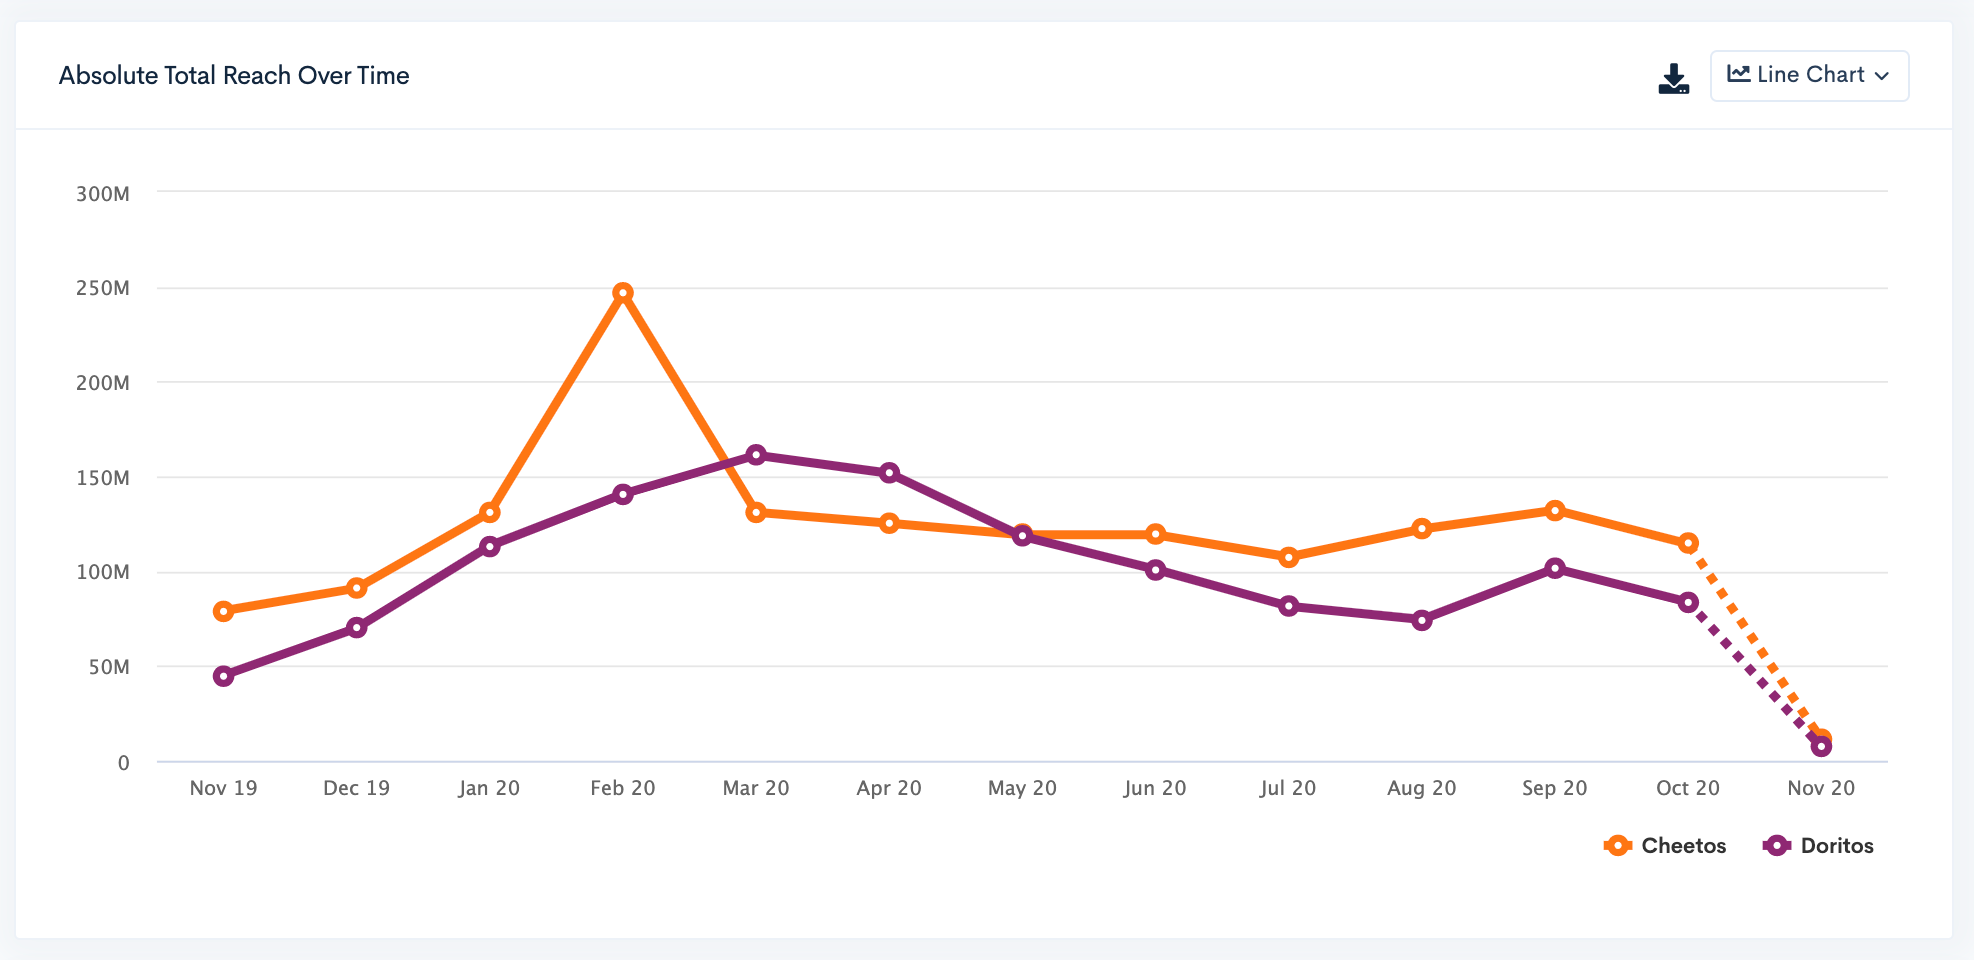
Absolute Total Reach
This is the total aggregate reach (followers) of all posts that mention your search terms. For example, if you have an account with 10,000 followers and posted 3 times using your search terms, their reach would count as 30,000 followers. You'll see that this number is much larger than Total Reach.
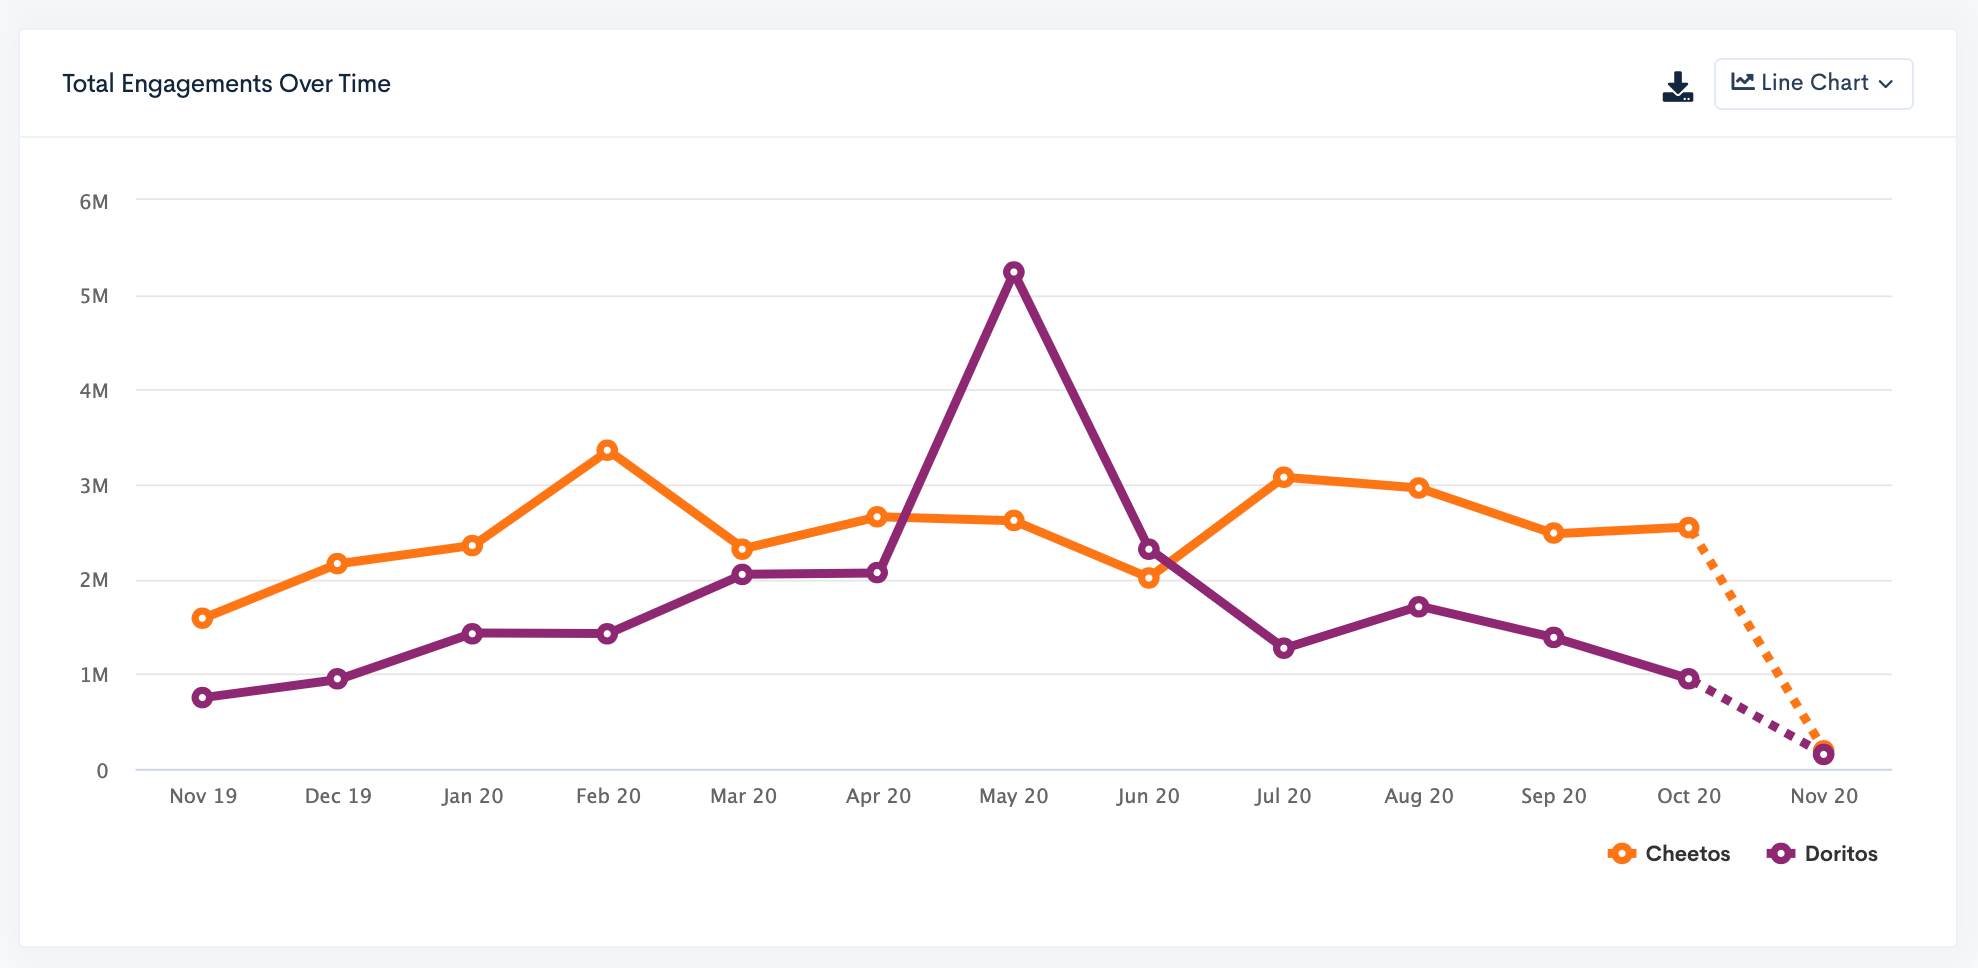
Total Engagements
The total sum of all engagements (likes, comments, shares, video views, etc) on all posts that are included in your search terms.
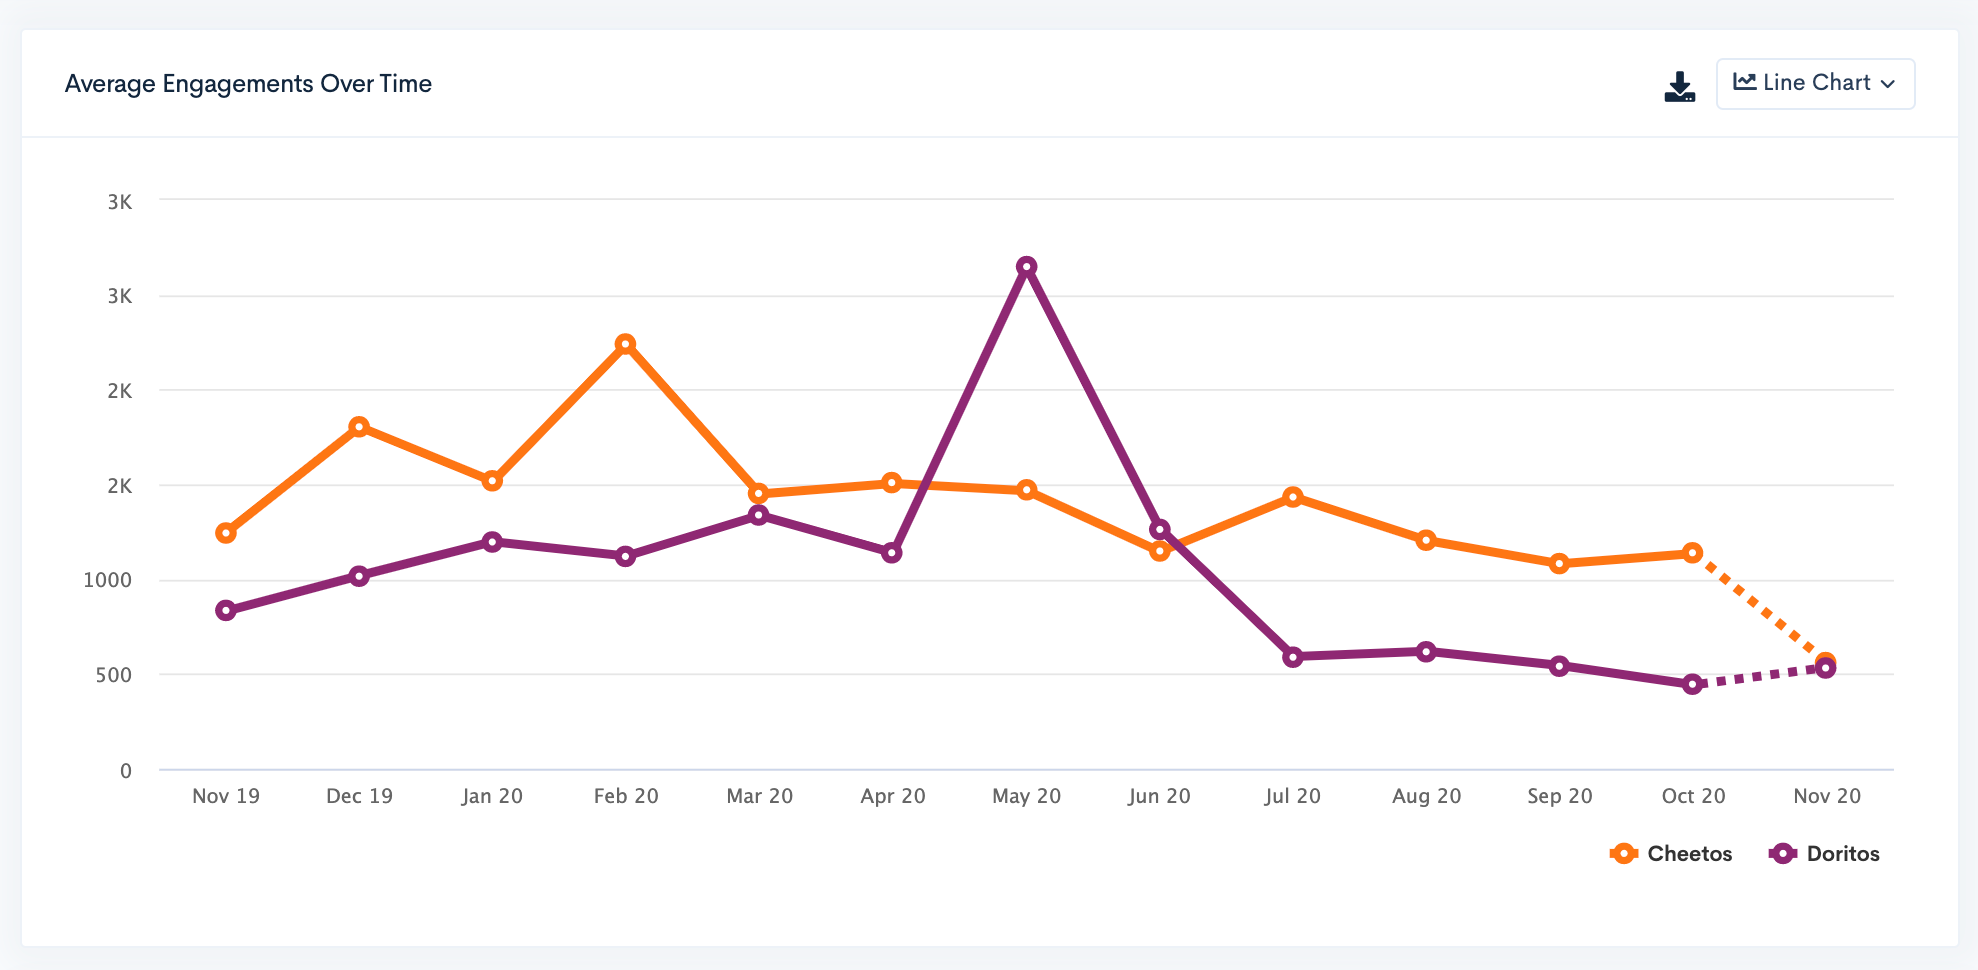
Average Engagements
This is calculated by taking the total number of engagements all posts receive divided by the total number of posts, to give an average engagement for one post. For example, if there are 100 posts with a total of 52,000 engagements, then the average engagement for is 520.
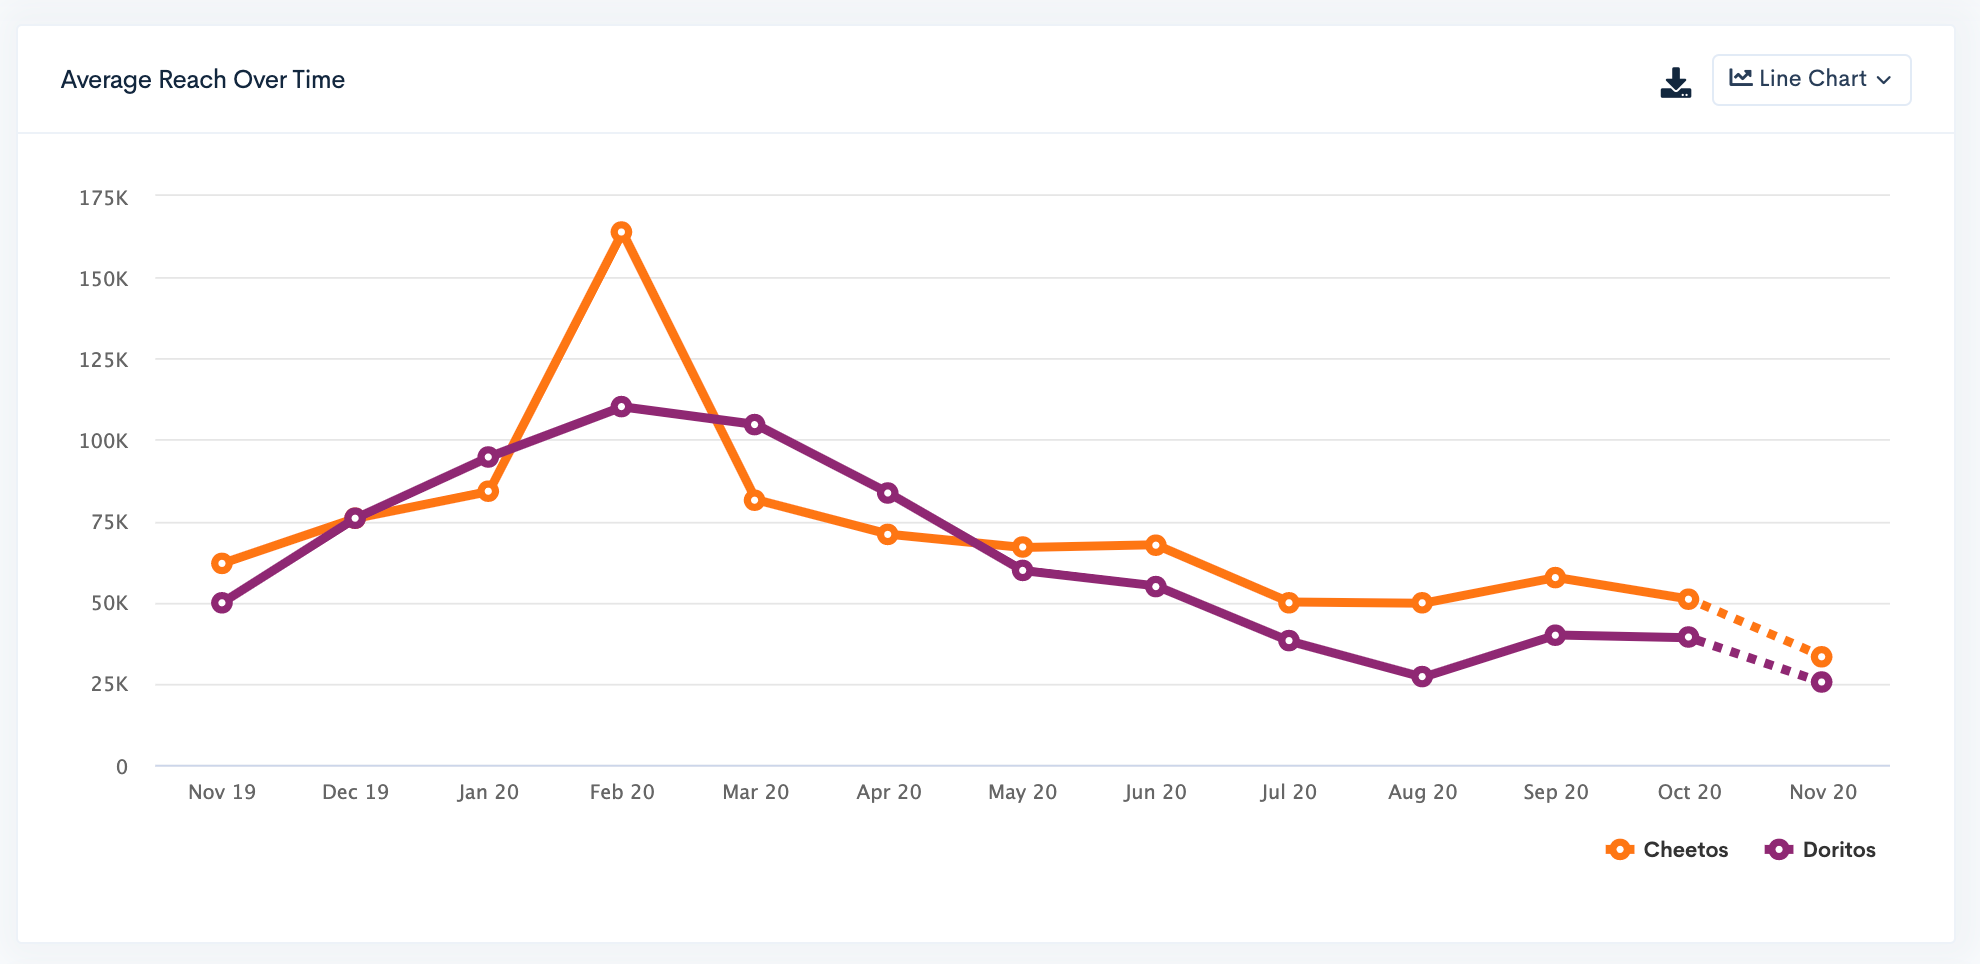
Average Reach
This is calculated by taking the reach of all posts and dividing it by the number of posts. For example, if you have 100 posts with a total reach of 520,000, then the average reach is 5,200.
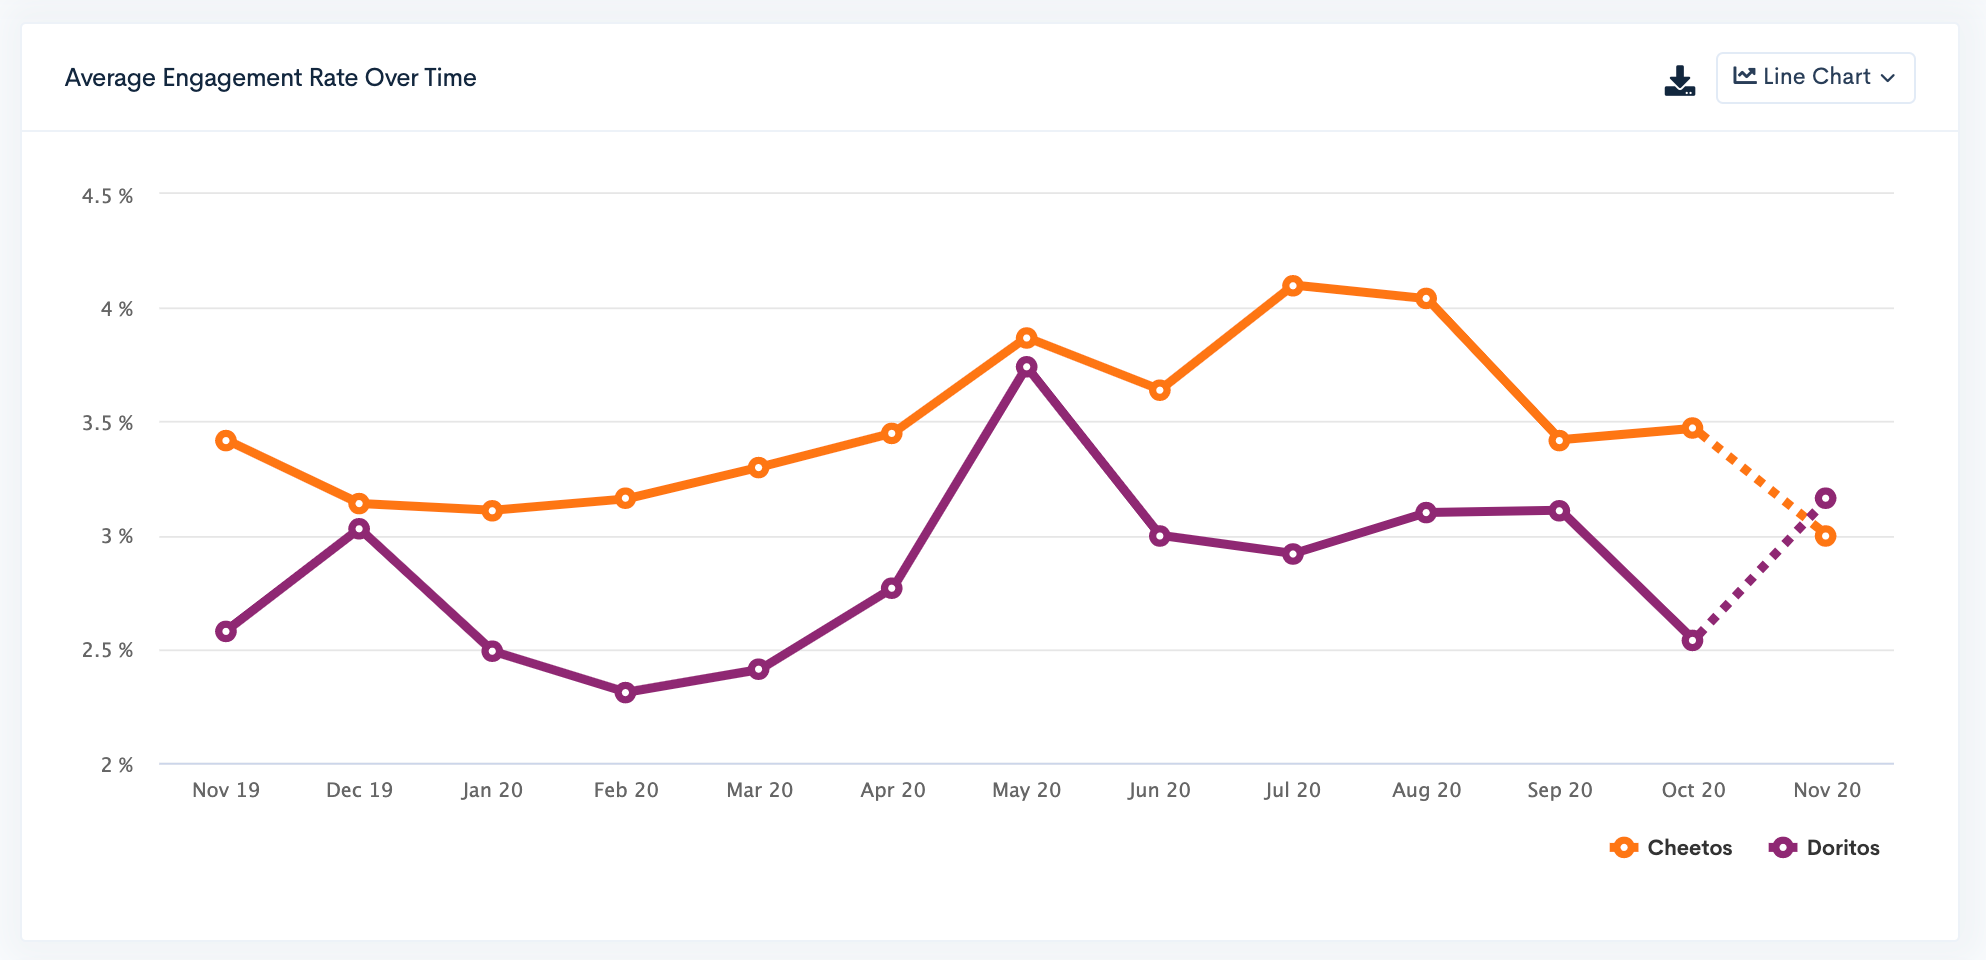
Average Engagement Rate
This is calculated by taking the total number of engagements divided by the total number of followers, and then multiplied by 100 to give a percentage. This represents the average engagement rate one post received in this search.
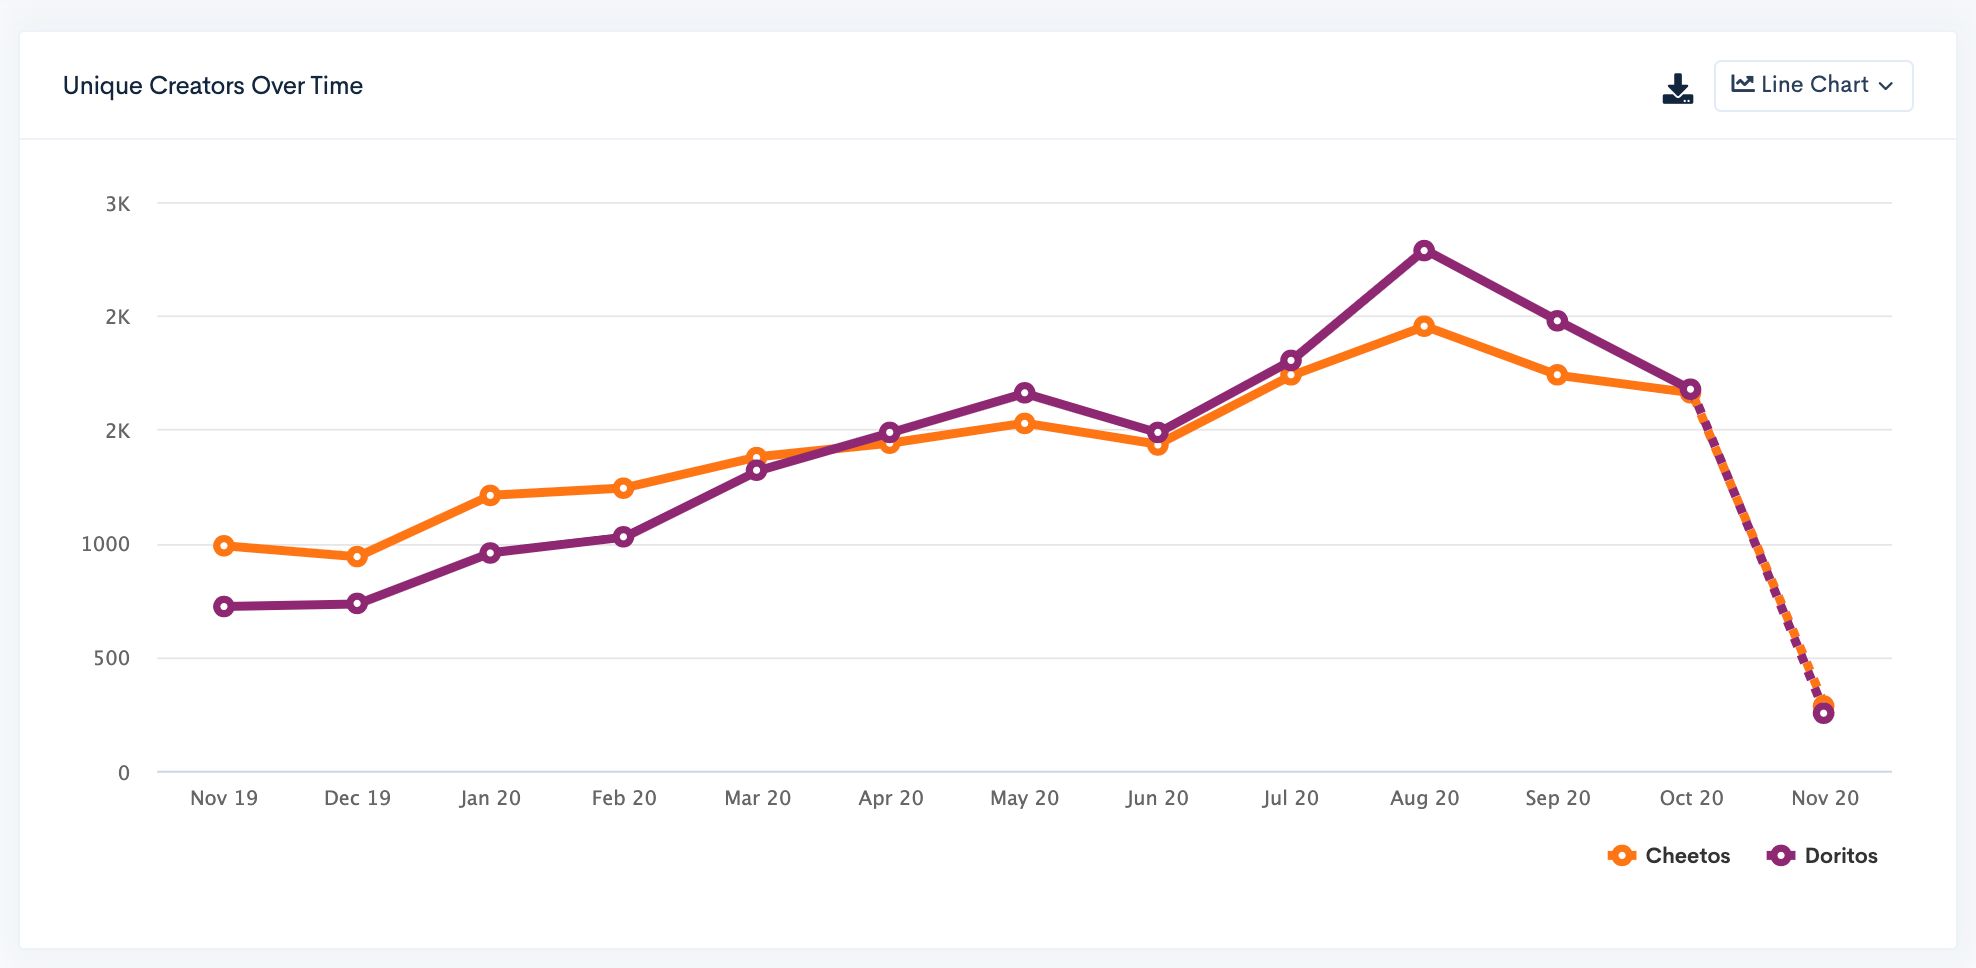
Unique Creators
The total number of individual creators posting content based on your search terms.
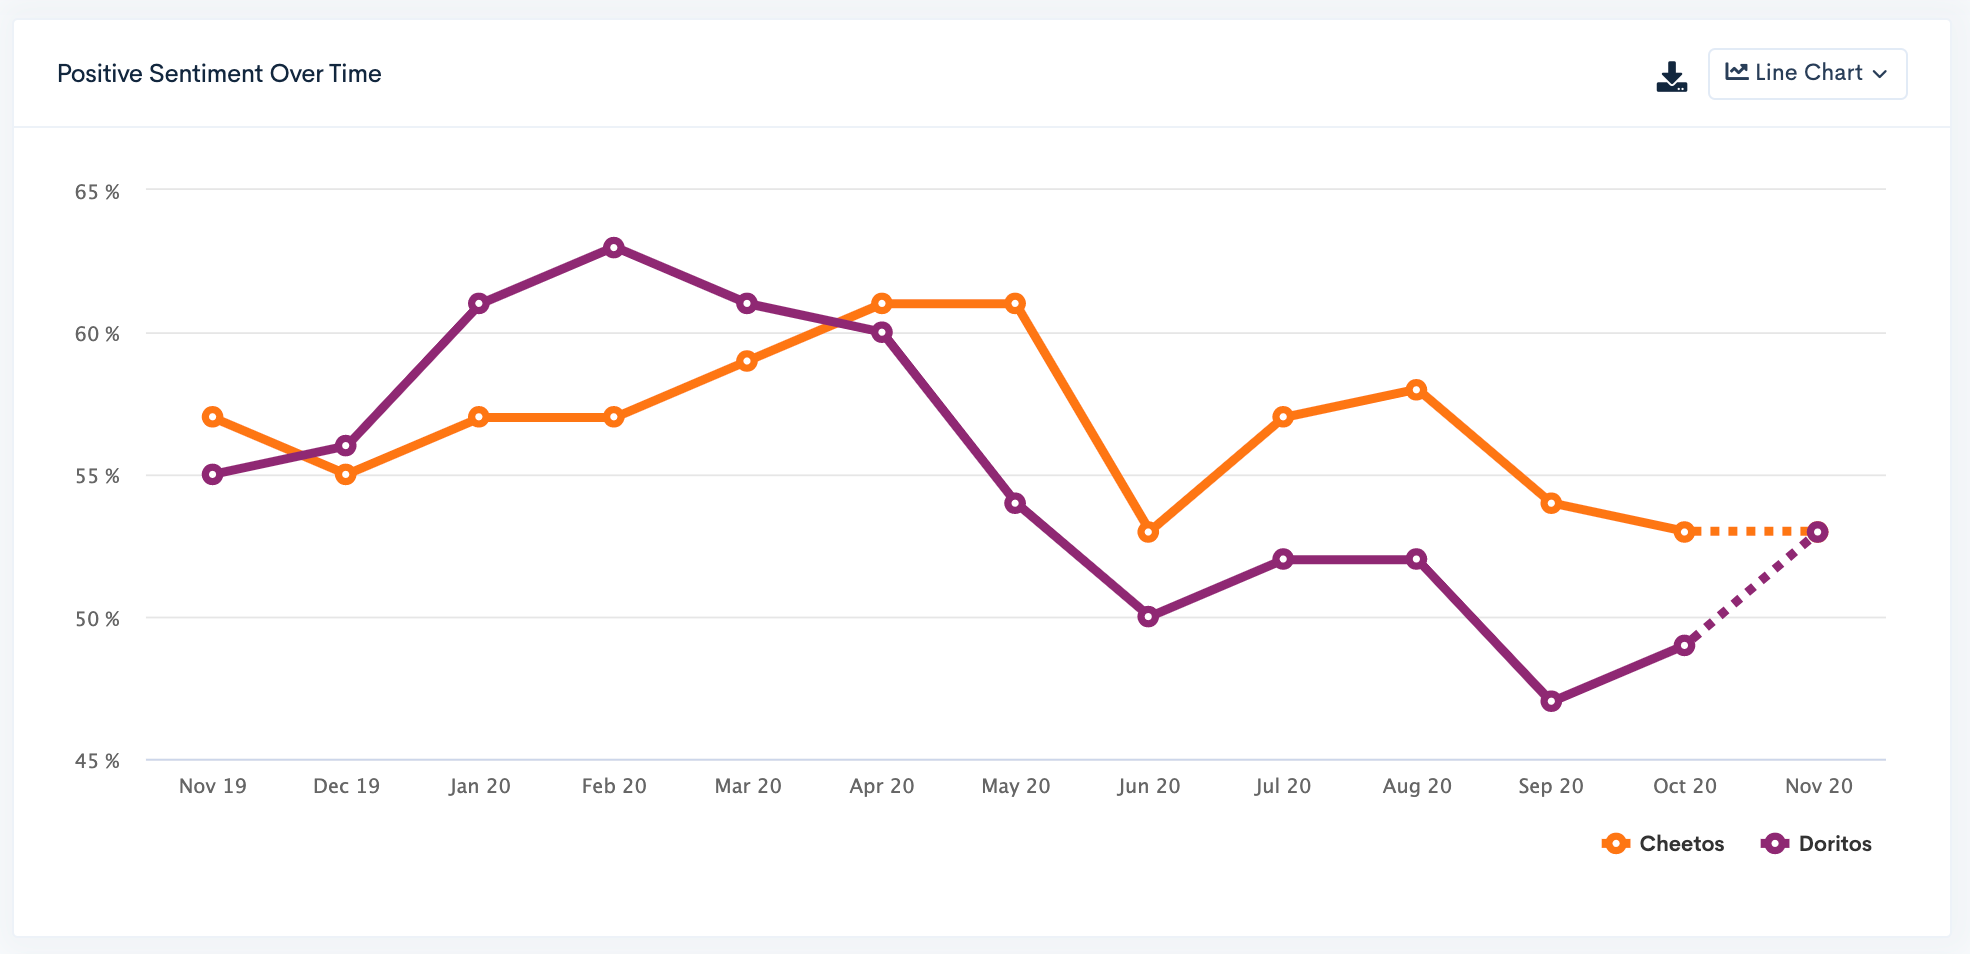
Positive Sentiment
The percentage of comments across all posts that contain a positive sentiment.
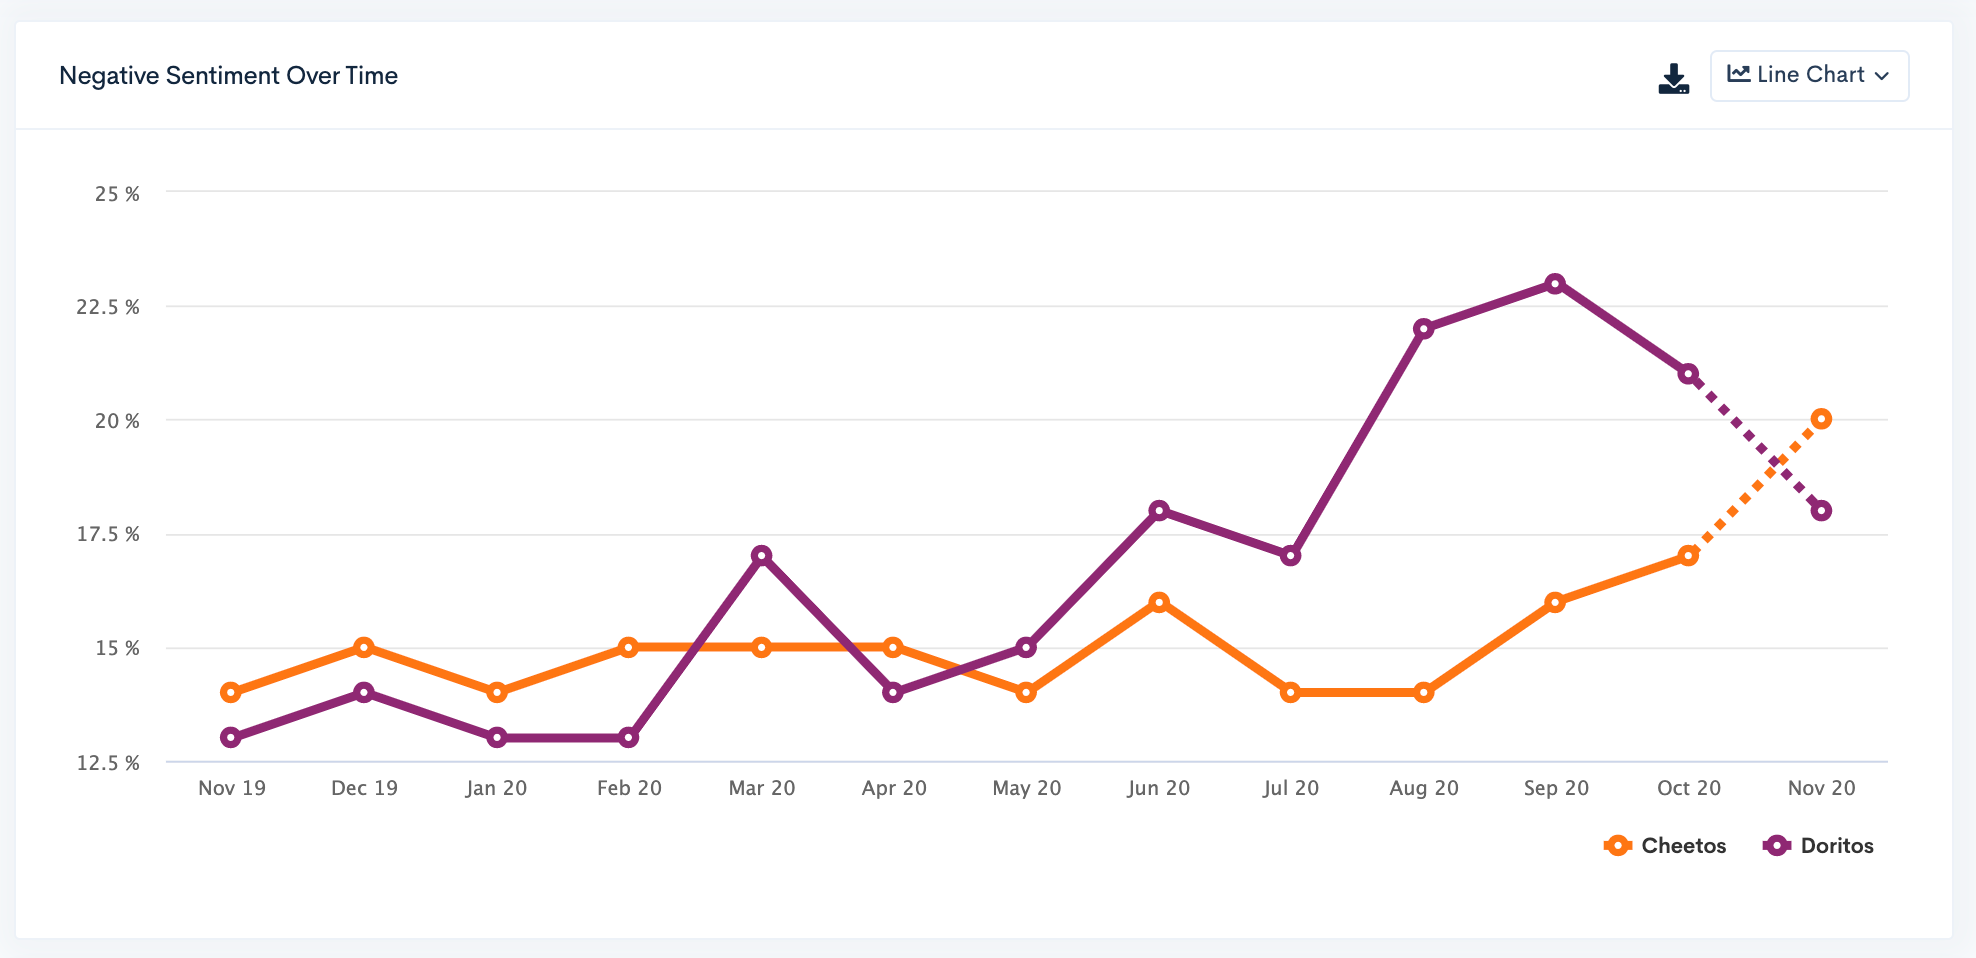
Negative Sentiment
The percentage of comments across all posts that contain a negative sentiment.
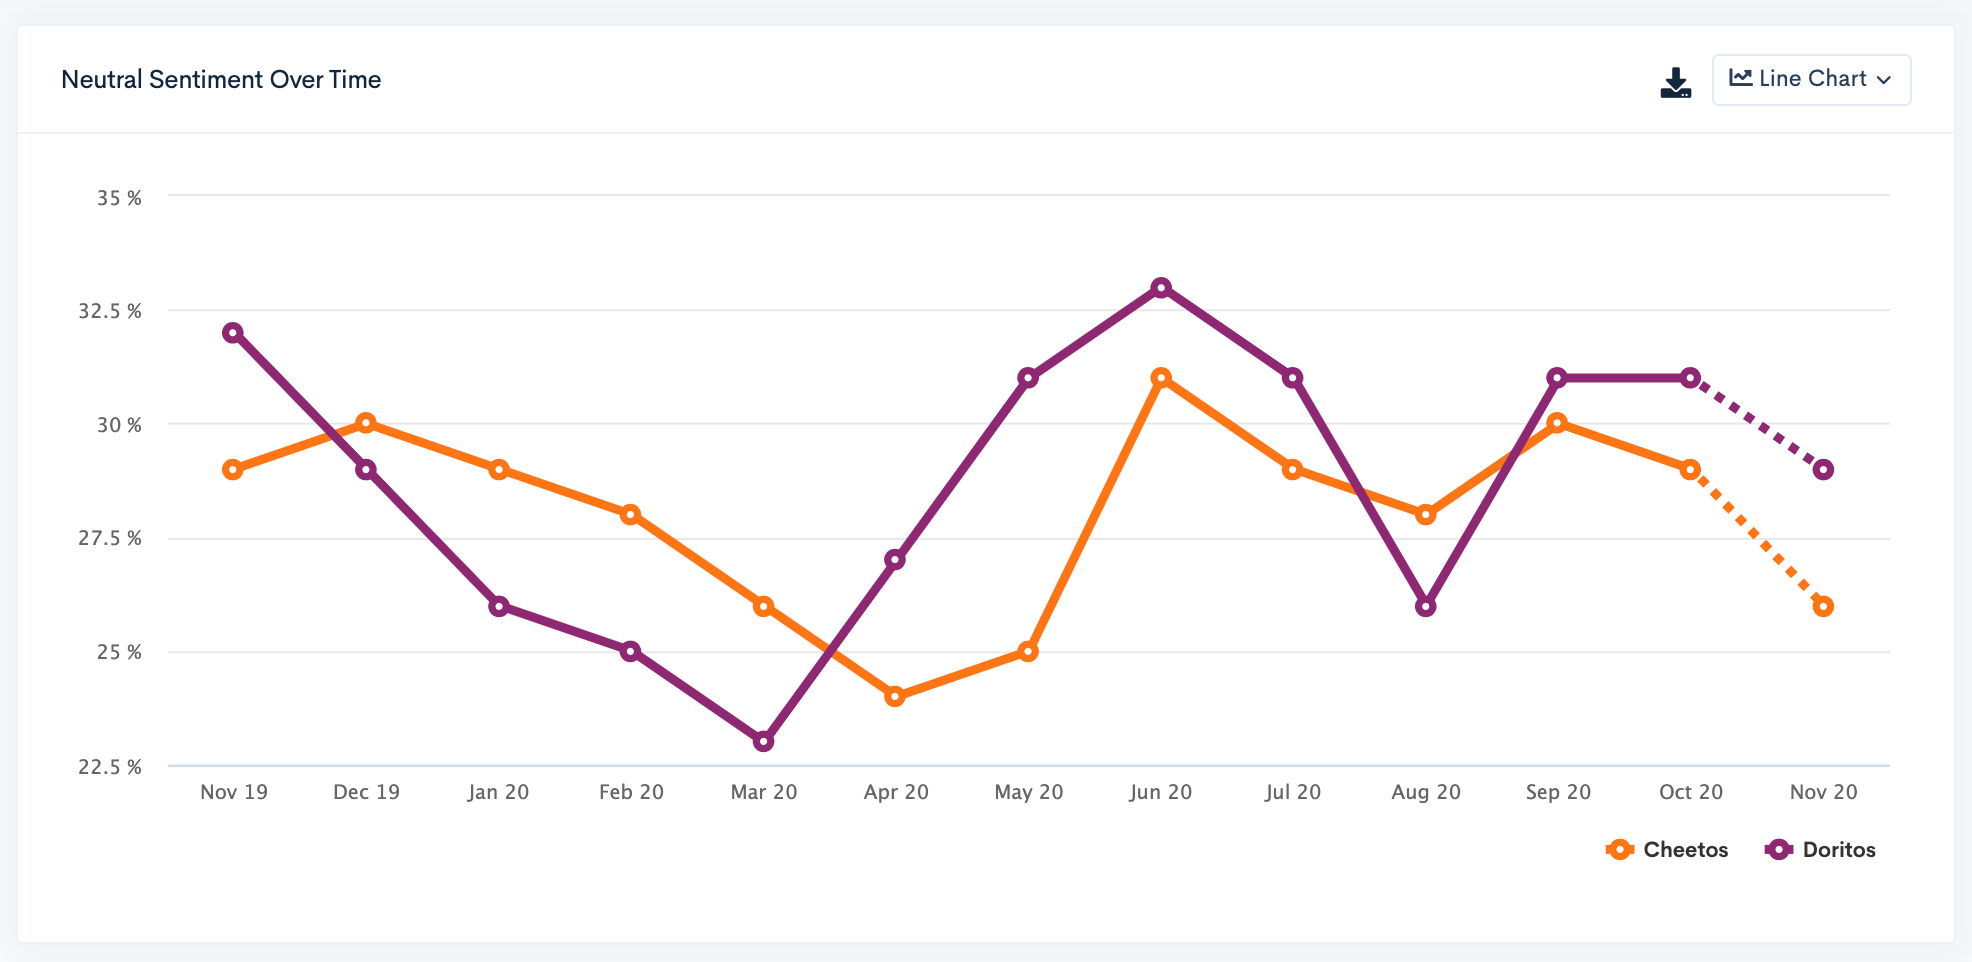
Neutral Sentiment
The percentage of comments across all posts that contain are neither positive nor negative.
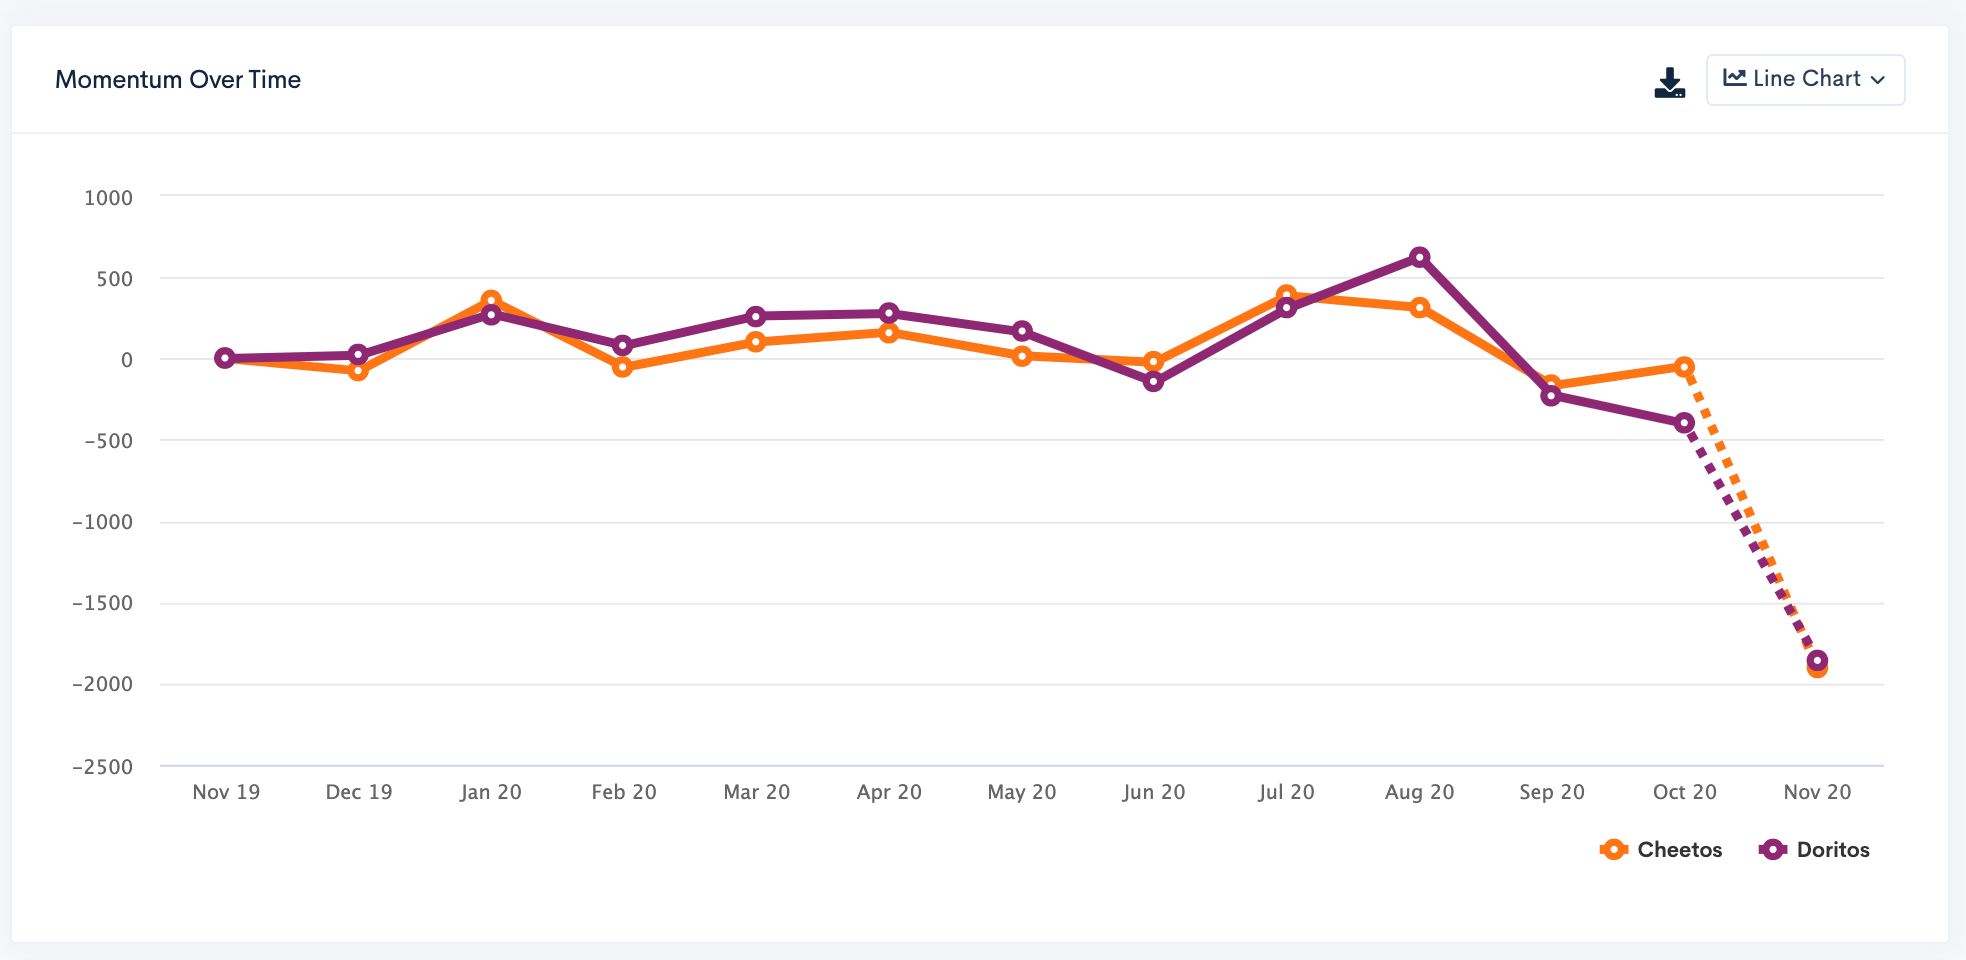
Momentum
The change in the number of pieces of content over the given period, either increasing or decreasing in number.