The Reports dashboard is where you can view any of your past In-Depth Reports, or run a New Report. This help doc will walk you through running a New Report and share helpful information stored in your Report Dashboard.
To get to your Reports dashboard, click on Reports in your BrandGraph toolbar.
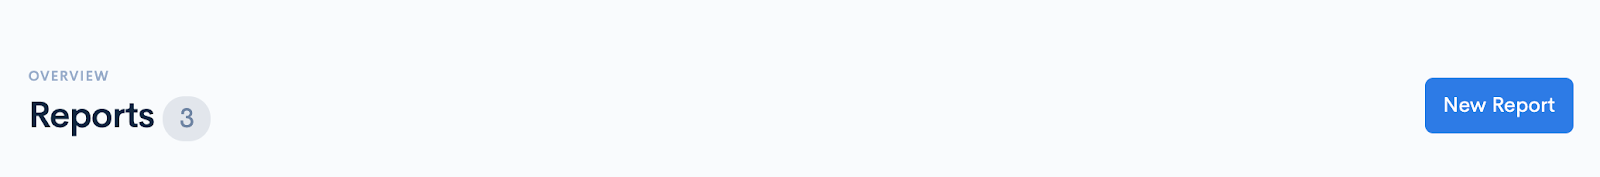
1. To run a new report, click on the New Report button.
2. Enter the below information and then click Generate Report.
- Brand Name (a drop down menu will appear)
- Description (optional)
- Start Date
- End Date
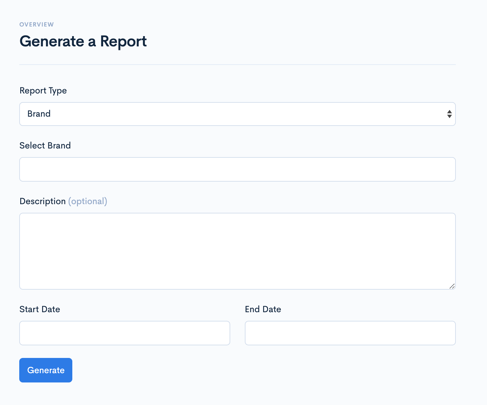
3. It will take several minutes for the data to be collected, and you’ll be notified via email once the report has been generated and ready to view.
Reports Table
The Reports table is where you can easily access a list of past reports and show you the below information:
- The Brand Name
- The report date range
- The dates each report was Created
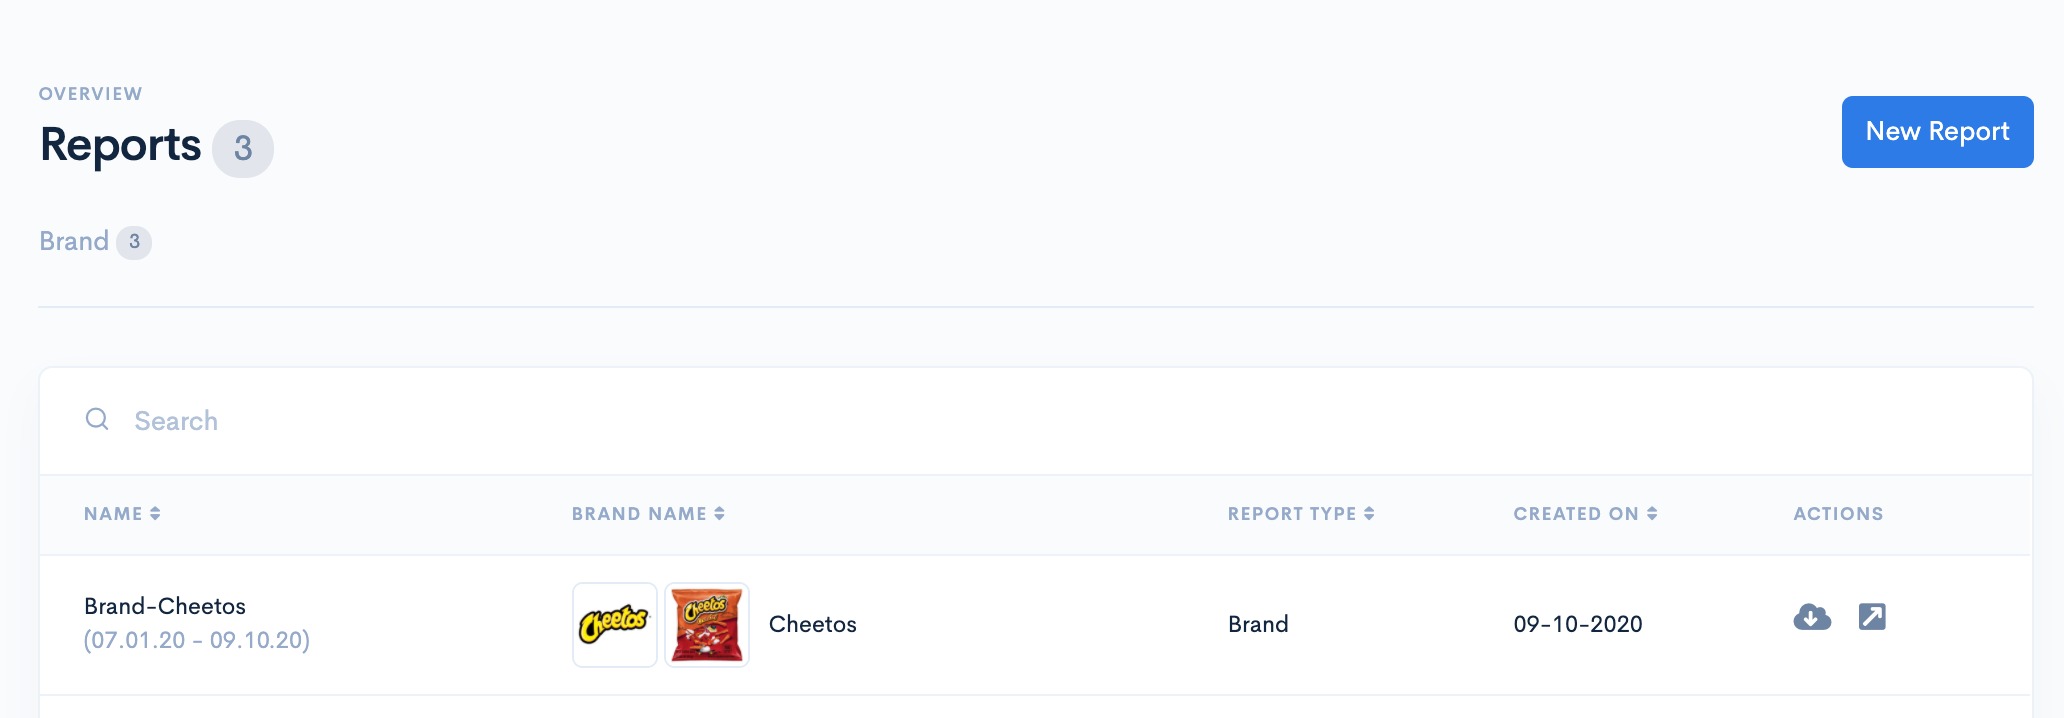
Actions
You can sort your table by any of the column headers:
- Report Name
- Brand Name
- Created On date.
You can Download or any report by clicking on Download icon or open the report by clicking on the Open icon. Downloading will save the PDF to your computer, and Opening the report will bring you to a new browser window.
